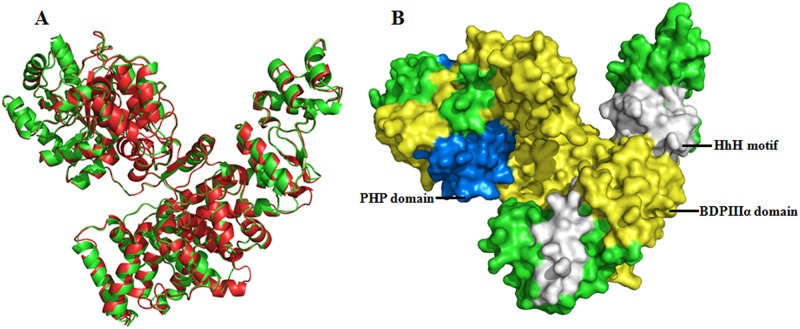
Fig 1. Superimposed Comparative Ribbon Model Structure and Conserved Domains of MtbDnaE2.
(A) Superimposed comparative model of MtbDnaE2 (green) on the 2HNH_A (red) template with RMSD value (1.4Å). This model was generated by Modeller9v10. The model’s ribbon structure was visualized by PyMoL Viewer (B) Connolly surface form of MtbDnaE2 model shows three out of the four conserved domains (identified by domain search)—PHP domain at N terminal, BDPIIIα domain, and HhH motif visualized by PyMOL viewer. The OB fold domain identified in the C-terminal region of MtbDnaE2 can not be seen, due the absence of C-terminal region in the template structure.

