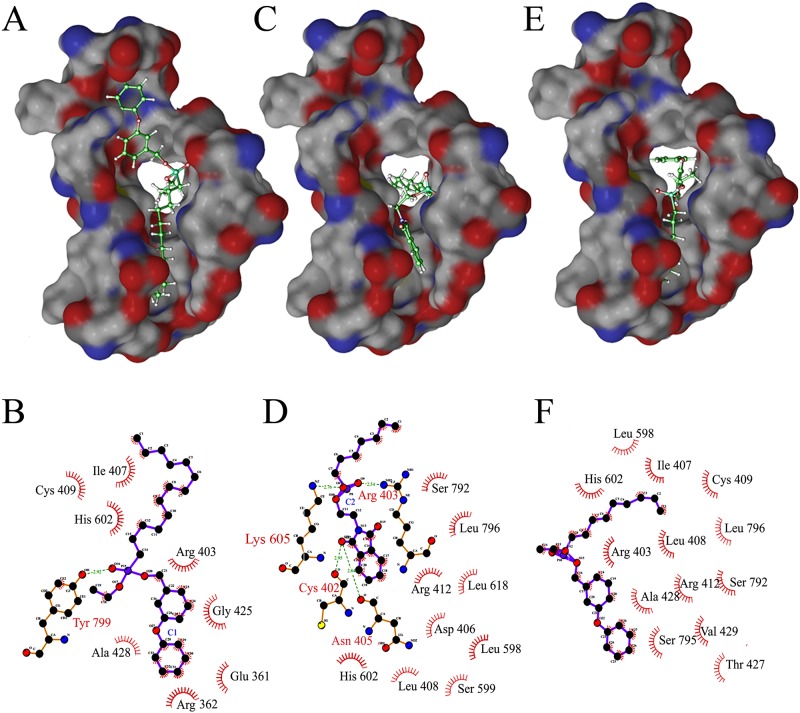
Fig 3. Docked Complex of MtbDnaE2 with ChEMBL Database Compounds.
Panels A, C, and E show the electrostatic surface potential of modeled MtbDnaE2 with bound ligands (stick models, shown in atom colors). (A) 1-[[ethoxy(tetradecyl)phosphoryl]oxymethyl]-3-phenoxybenzene (C1), (C) 2-(1,3-dioxoisoindol-2-yl)ethoxy-heptylphosphinic acid (C2), (E) 1-[[ethoxy(nonyl)phosphoryl]oxymethyl]-3-phenoxybenzene (C3) respectively. In ligplot, Panels B, D, and F show 2D representation of ligand C1, C2, and C3 with the interacting amino acid residues of MtbDnaE2. Green dashed lines indicate hydrogen bonds, with the numbers indicating the interatomic distances (Å). The labeled arcs with radial spokes that point toward the ligand atoms show the hydrophobic interactions with the corresponding amino acid residues.

