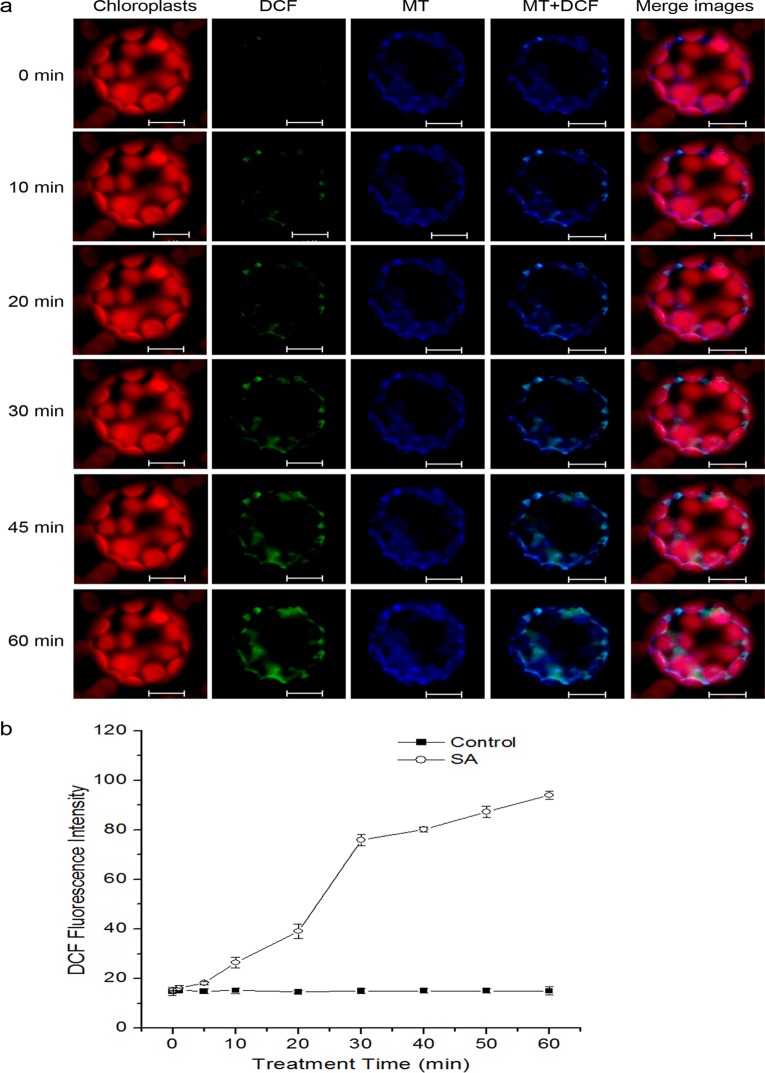
Fig 2. Generation of mtROS under SA treatment in Arabisopsis protoplasts.
(a) The fluorescence imaging of DCF and MitoTracker Red CMXRos in Arabidopsis protoplasts. Protoplasts were treated with or without SA for the indicated time, double-stained with H2DCFDA and MitoTracker Red CMXRos (MT), and detected using a LCSM. Scale bars, 10 μm. (b) Kinetics graphs of DCF signal intensity of SA-treated isolated mitochondria. Error bars are ±SD values for three replicates.

