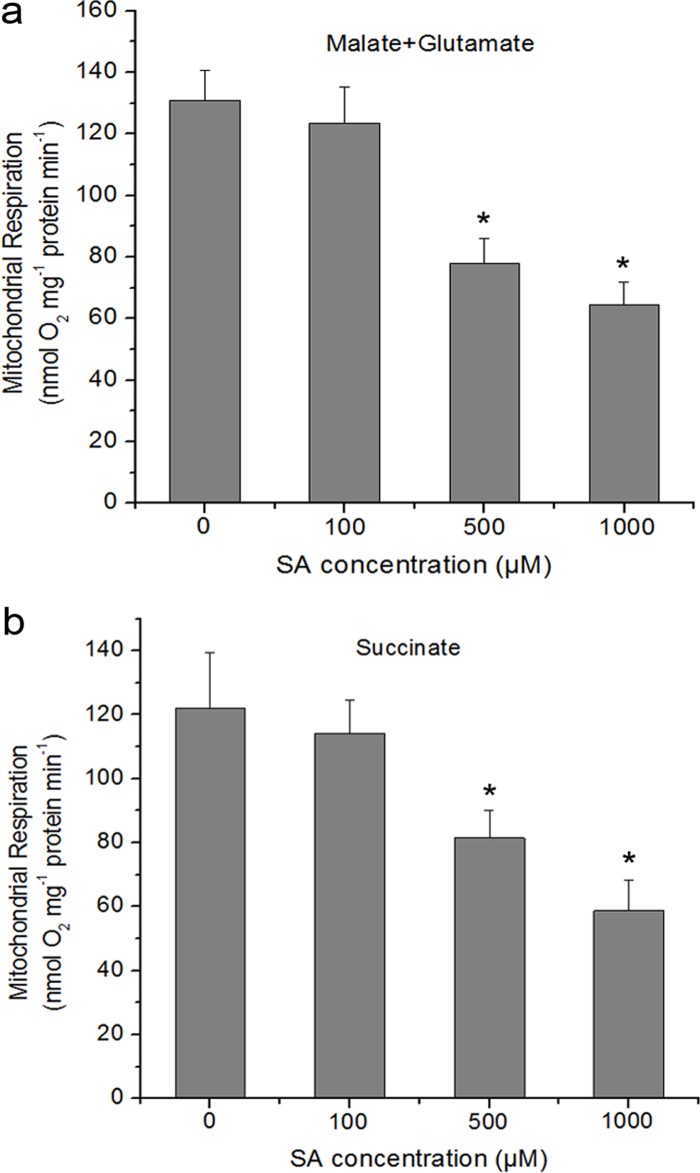
Fig 4. Respiratory parameters of the isolated mitochondria in response to different concentrations of SA.
Respiration rates (nmol O2 mg−1 protein min−1) were measured using 5 mM malate plus 10 mM glutamate (a) or 10 mM succinate (b) as respiratory substrates. SA was added to the reaction vessel to the final concentration indicated for each histogram. Asterisks indicate significant differences to 0 μM SA (Student’s t-test, P <0.05). Each value is the mean ± SD of four replicates.

