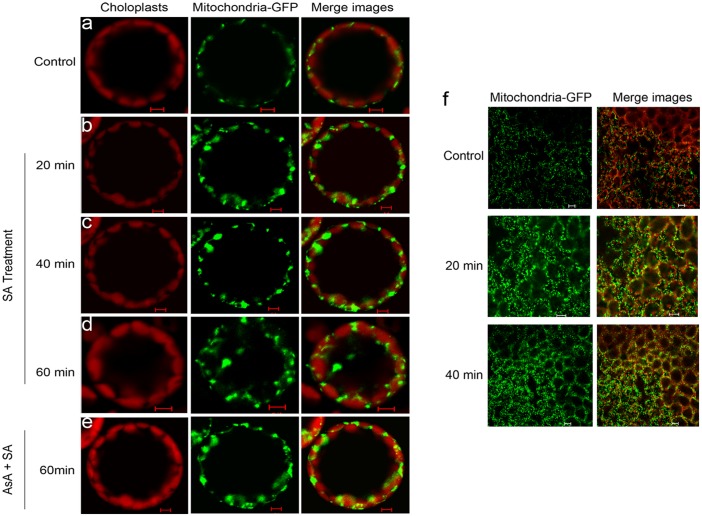
Fig 7. Abnormal Mitochondrial morphology after treatment with SA.
Confocal images of mito-GFP mesophyll protoplasts were taken in the absence of 500 μM SA for 1 h (a) or in the presence of 500 μM SA for 20 min (b), 40 min (c) or 60 min (d). Confocal images of mito-GFP mesophyll protoplasts which were pre-incubated with AsA at 1 mM final concentration for 30 min and treated with SA for 1 h were also taken (e). Scale bars, 10 μm. (f) Micrographs of mitochondrial morphology in Arabidopsis leaf tissue during SA treatment. Leaves of at least five plants were examined, and the experiment was performed three times. Chloroplast autofluorescence is false colored red, and GFP fluorescence is false colored green. Scale bars, 20 μm.

