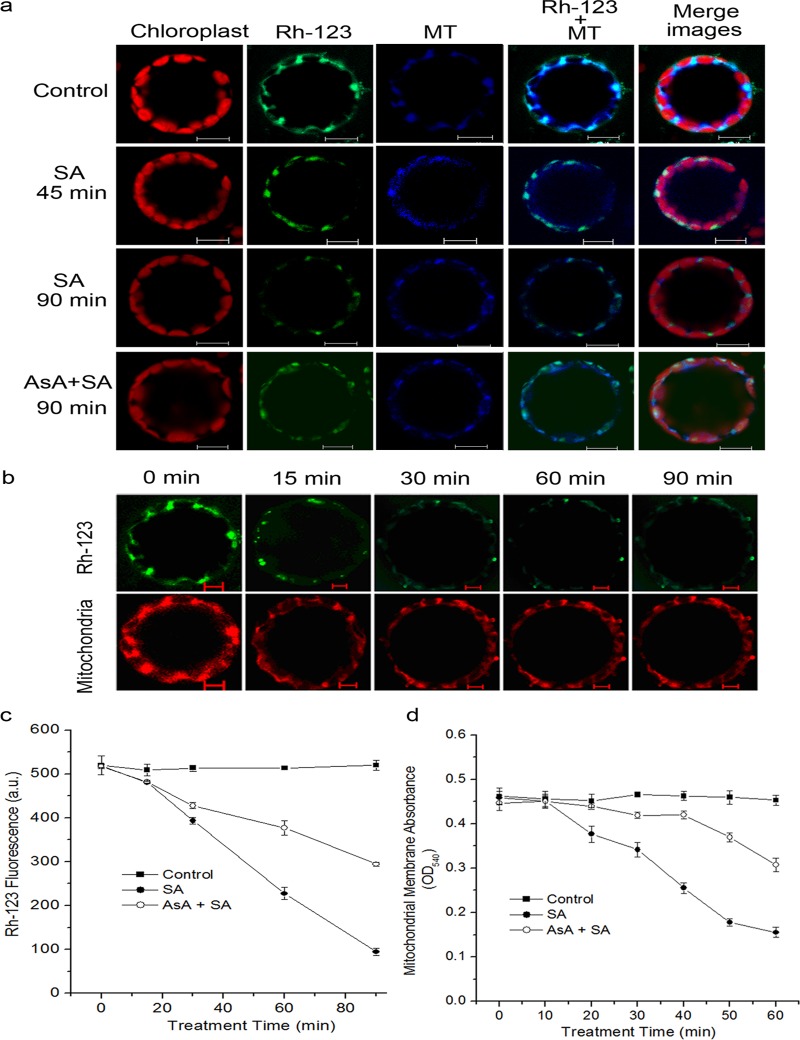
Fig 8. Mitochondrial depolarization induced by SA treatment.
(a) Protoplasts were pre-incubated with or without AsA at 1 mM final concentration for 30 min, and were then untreated for 1.5 h or treated with 500 μM SA for 1.5 h. Samples were double stained with Rh-123 and MitoTracker Red CMXRos and observed with a LCSM. (b) Time course of the fluorescence intensity of Rh-123 or MitoTracker within 1.5 h after treatment with SA. Scale bars, 10 μm. (c) Analysis of mitochondrial MTP in SA-treated protoplasts using fluorescence probe Rh-123. (d) Mitochondrial swelling indicated by the changes in absorbance at 540 nm (OD540). In (c) and (d), each value is the mean ± SD of three replicates.

