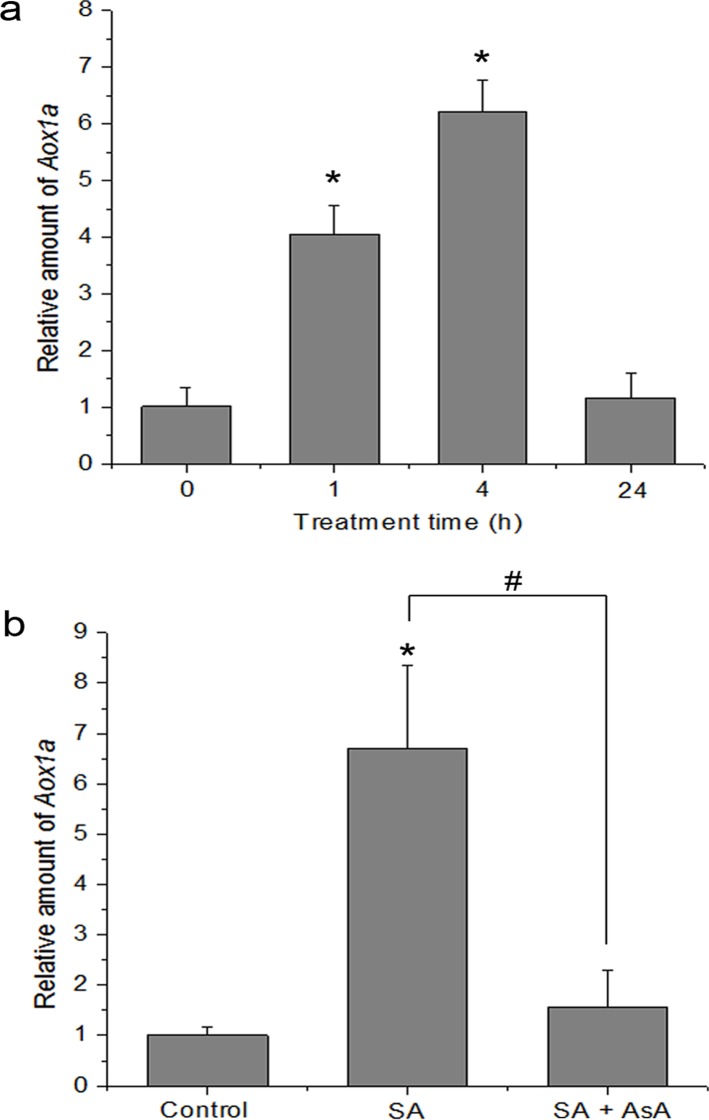
Fig 9. Effect of SA on the expression of Aox1a transcript.
(a) Real-time quantitative RT-PCR of Aox1a from control (0 h) and seedlings treated with 500 μM SA for 1, 4 and 24 h. Statistical analysis was performed with Student’s t-test: *, P < 0.05 vs 0 h. (b) Effect of antioxidant AsA on SA-induced AOX1a gene expression. The seedlings were treated with 500 μM SA for 4 h. Statistical analysis was performed with Student’s t-test: *, P < 0.05 vs control. #, P < 0.05 vs SA. Data are means ± SD of three different experiments, with similar results.

