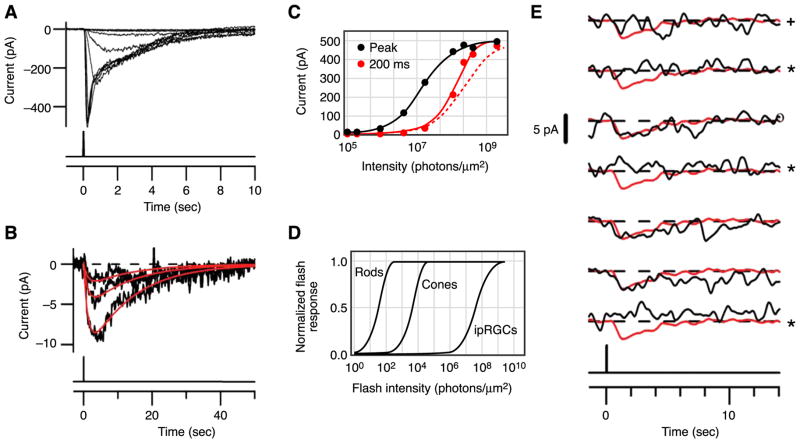
FIG. 7.
Flash response and absolute sensitivity of ipRGCs. A: responses of an ipRGC in the flat-mount retina to diffuse 50-ms flashes at different intensities. Stimulus timing is shown below. B: three smallest responses from A, elicited by successive approximate doublings of flash intensity, on expanded ordinate and longer time base, to demonstrate linearity. Responses fit with the same convolution of two single-exponential decays but scaled by the relative flash intensities (red). C: intensity-response relationships plotted from A. Black circles, peak response-intensity relationship fit with Michaelis equation; red circles, instantaneous intensity-response relationship at 200 ms from flash onset, fit with a saturating exponential function. Dashed curve is a Michaelis fit aligned for comparison with saturating-exponential fit. D: comparison of flash intensity-response relations for rods, cones, and ipRGCs. Rod and cone relations are saturating exponentials (not very different from Michaelis in shape or, for rods and cones, the half-saturating flash intensity), and ipRGC relation is Michaelis. E: partial series of responses of an in situ ipRGC to repeated identical flashes, mostly too dim to elicit a response, at 35°C. The unitary response, by fluctuation analysis, was 2.3 pA. Red traces are identical and represent the expected profile of the unitary response (a brighter flash within the linear range of the cell, scaled to 2.3 pA). Apparent failures (marked by *) and an ambiguous trial (marked by +) were judged according to several detection algorithms. [A–E modified from Do et al. (39).]

