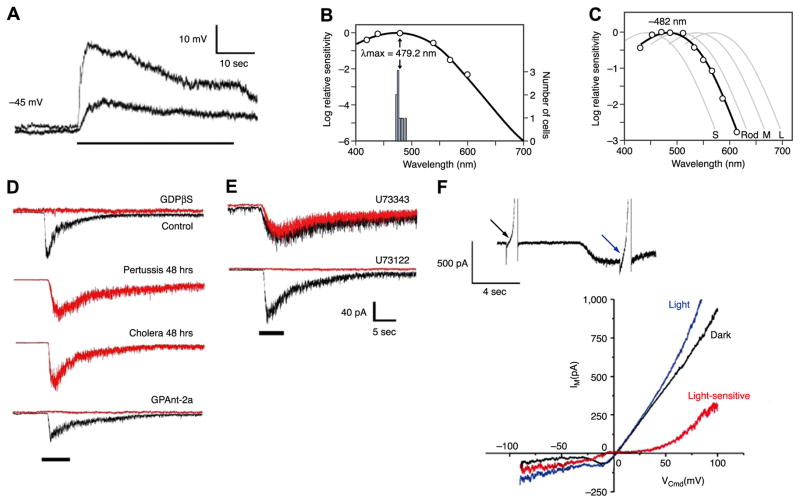
FIG. 9.
Melanopsin phototransduction. A: heterologous expression of mouse melanopsin conferring photosensitivity to a HEK293 cell. Traces show voltage responses to two light intensities (stimulus marked by horizontal bar below the traces). B: spectral sensitivity of light response of HEK293 cells expressing melanopsin heterologously. Curve is opsin-based pigment nomogram with λmax = ~480 nm, similar to that of ipRGCs. [A and B modified from Qiu et al. (161).] C: spectral sensitivity of macaque ipRGC with nomogram fit, together with those (faint curves) of macaque rods as well as macaque short- (S), medium- (M), and long-wavelength (L) cones. [Modified from Dacey et al. (35).] D: block of intrinsic photosensitivity of cultured rat ipRGCs by GDPβS (general G protein blocker) and by GPAnt-2 (Gq subfamily blocker) but not following prolonged exposure to pertussis and cholera toxins (which affect Gi and Gs subfamilies, respectively). E: block of intrinsic photosensitivity of cultured rat ipRGCs by U73122 (phospholipase C blocker) but not by its inactive analog. [D and E modified from Graham et al. (65).] F: current-voltage relation of the intrinsic photocurrent. The membrane currents of an ipRGC elicited by voltage ramps delivered in darkness (black) and light (blue). Difference gives the light-sensitive current (red). [Modified from Warren et al. (219).]

