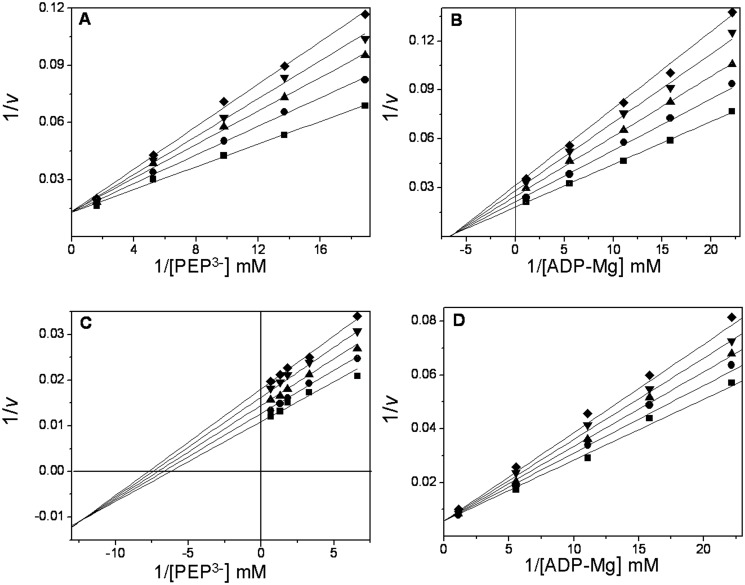
Fig 3. Dead-end inhibition patterns and inhibition constants for oxalate and AMP in TpPK.
The experimental conditions were as indicated in Fig. 2. The reciprocals of the concentrations of ionized PEP and ADP-Mg complexes are shown in the abscissas of each graph. In plot A, the concentrations of PEP3- were 0.054, 0.077, 0.10, 0.22, and 1.1 mM. The Mg2+ free and ADP concentrations were kept constant at 30 mM and 2 mM, respectively. The fixed concentrations of oxalate were 0 (∎), 10 (●), 20 (▴), 30 (▾) and 40 (◆) μM. In plot B, the concentrations of the ADP-Mg complexes were 0.045, 0.063, 0.090, 0.18, and 0.90 mM. The ionized PEP concentration was kept constant at 30 mM. The Mg2+ free and oxalate concentrations were as in plot A. In plot C, the concentrations of PEP3- were 0.15, 0.30, 0.55, 0.77, and 1.5 mM. The Mg2+ free and ADP concentrations were as in plot A. The fixed concentrations of AMP were 0 (∎), 4 (●), 8 (▴), 12 (▾) and (◆) 16 mM. In plot D, the concentrations of ADP were as in plot B. The Mg2+ free and ionized PEP concentrations were kept constant at 30 mM. The concentrations of AMP were 0 (∎), 8 (●), 12 (▴), 16(▾) and 20 (◆) mM.

