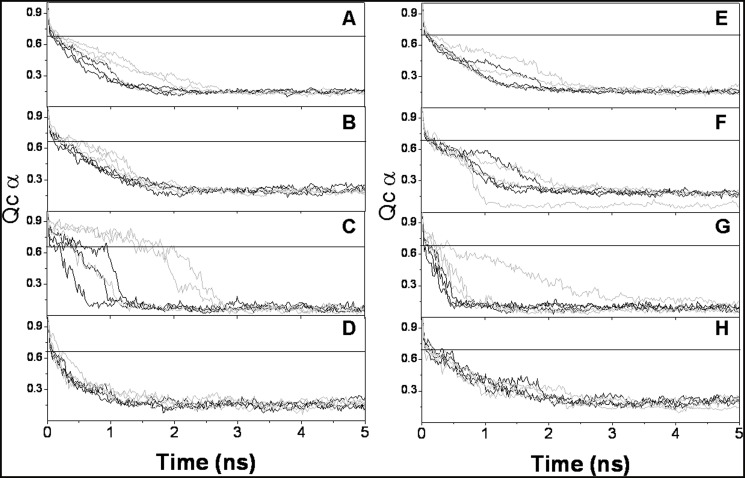
Fig 5. Loss of native contacts (QCα) versus time for the modeled TpPKs and RMPKs at 500 K.
The native contacts for the PK monomer and of the A, B and C domains are shown. TpPKs and RMPKs correspond to panels A through D and to panels E through H, respectively. Simulations were performed for 50 ns in an implicit solvent at 500 K. The simulations were started from two different conformations of the enzymes, open (black lines) and closed (grey lines). The open and closed conformations for TpPK were modeled as described in Material and Methods. The open and closed conformations for RMPK were obtained for PDBID 2G50 and PDBID 1A5U, respectively. The simulations were run in triplicate. Although the simulations were run for 10 to 50 ns, only the relevant periods for the transitions are shown.

