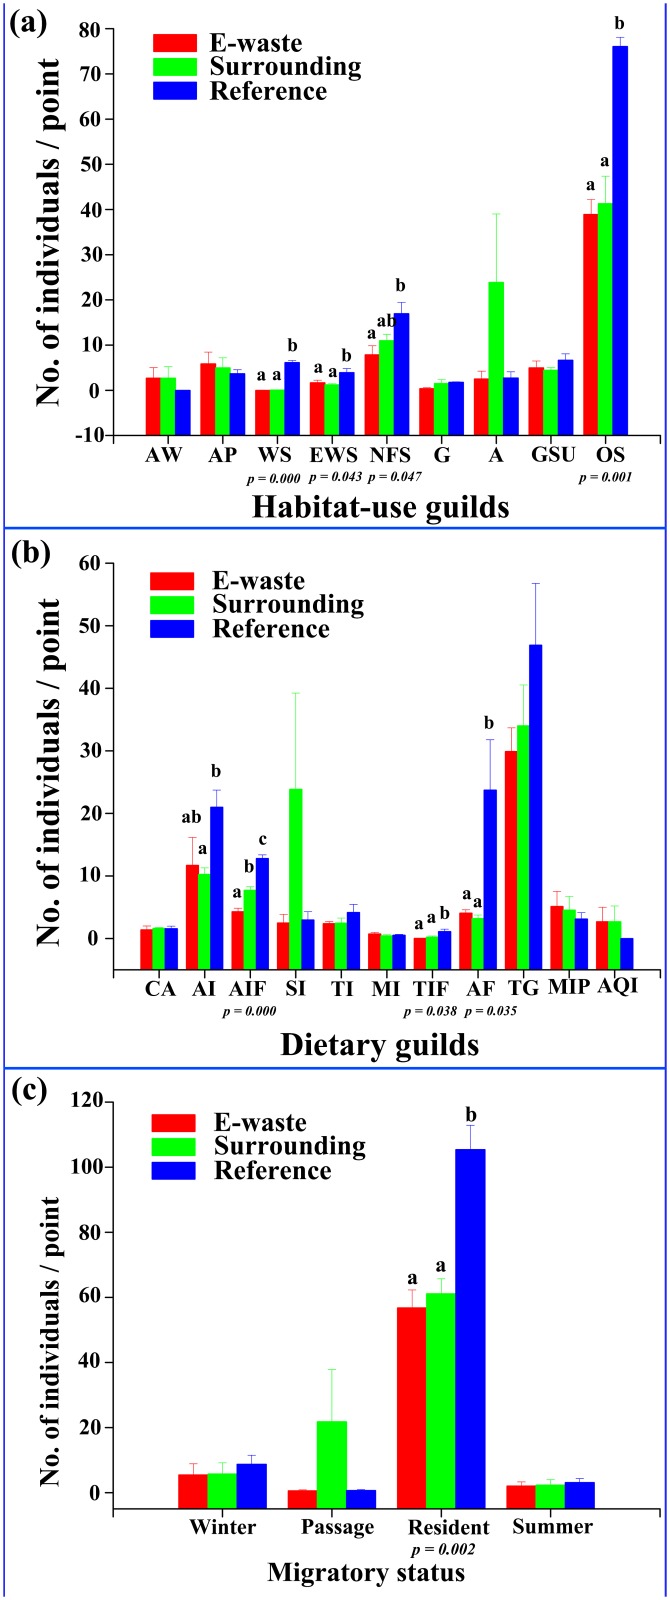
Fig 4. Changes in the relative abundance of birds grouped by (a) habitat preference, (b) dietary guilds, and (c) migratory status.
Habitat preference codes: “artificial marshland or wetland (AW)”; “aquatic ponds and paddy (AP)”; “woodland specialist (WS)”; “edge-tolerant woodland species (EWS)”; “non-forest dependent species (e.g., plantation and orchard; NFS)”; “generalist (G)”; “aerial species (A)”; “grassland and shrub users (GSU)” and “open-habitat species (OS)”. Dietary guild codes: “carnivore (CA)”, “arboreal foliage glean insectivore (AI)”, “arboreal foliage glean insectivore-frugivore (AIF)”, “sallying insectivore (SI)”, “terrestrial insectivore (TI)”, “miscellaneous insectivore (MI)”, “terrestrial insectivore-frugivore (TIF)”, “arboreal frugivore (AF)”, “terrestrial granivores (TG)”, “miscellaneous insectivore-piscivore (MIP)”, and “aquatic invertebrate (AQI)”. Different letters at each box indicate significant differences at a = 0.05. P values are derived from F tests that use the type III sums-of-squares obtained from linear mixed models.

