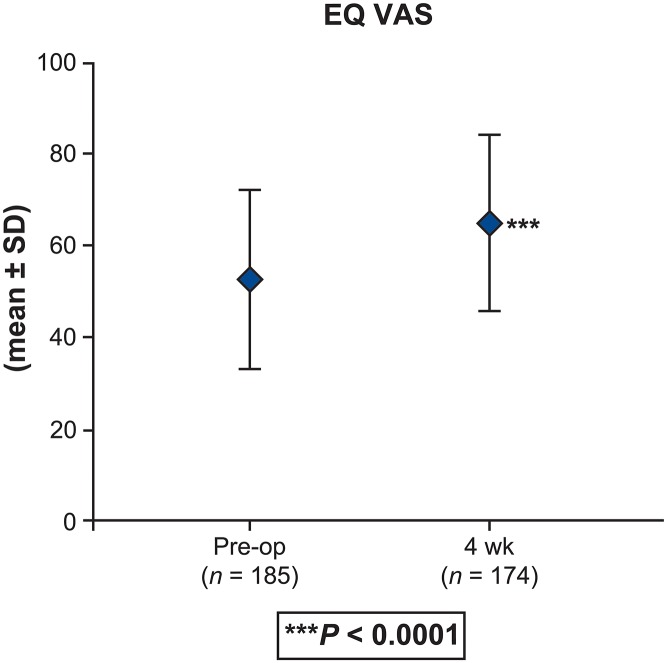
Fig 4. EQ VAS scores reported preoperatively and 4-week postoperatively on a 0 to 100 scale, where 0 = maximal health-related problems and 100 = minimal health-related problems (total population; N = 252).
P < 0.0001 for difference between preoperative (52.9 ± 19.5) and 4-week postoperative scores (65.4 ± 18.6).

