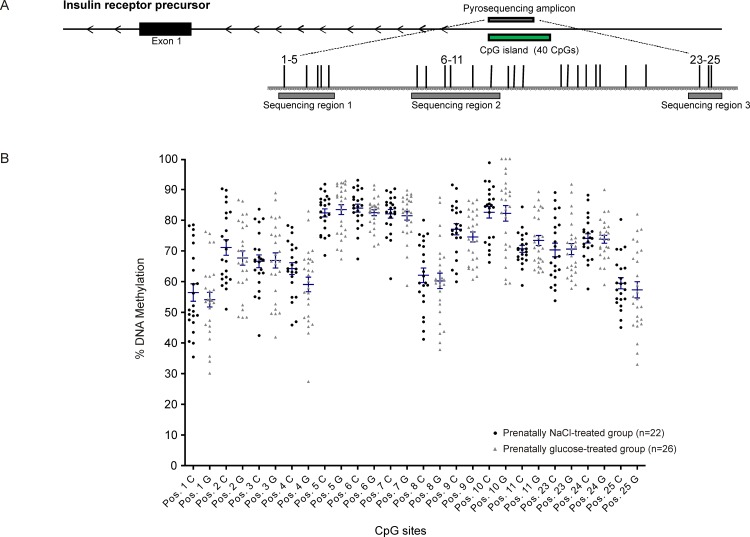
Fig 2. Insulin receptor (INSR).
Schematic illustration of sequence map of the insulin receptor (INSR) gene promoter region with chromosomal location of pyroassay (A), and corresponding DNA methylation levels at individual CpG sites for prenatally NaCl-treated controls (black) and the prenatally glucose-treated group (gray) (B).

