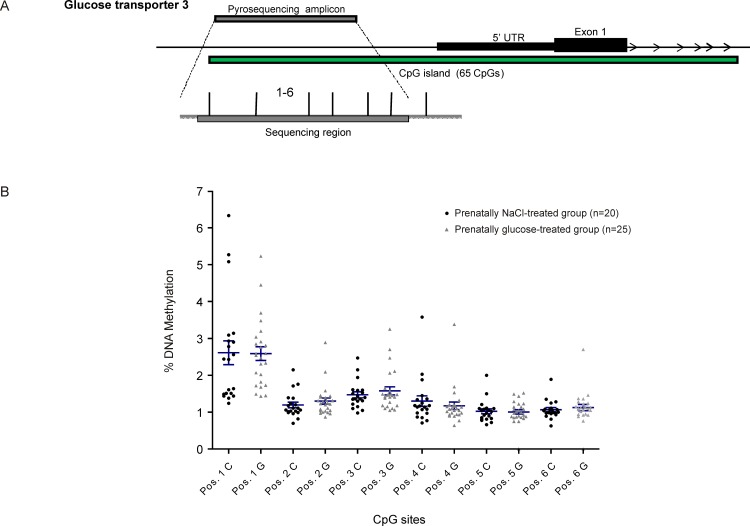
Fig 5. Glucose transporter 3 (GLUT3).
Schematic illustration of sequence map of the glucose transporter 3 (GLUT3) gene promoter region with chromosomal location of pyroassay (A), and corresponding DNA methylation levels at individual CpG sites for prenatally NaCl-treated controls (black) and the prenatally glucose-treated group (gray) (B).

