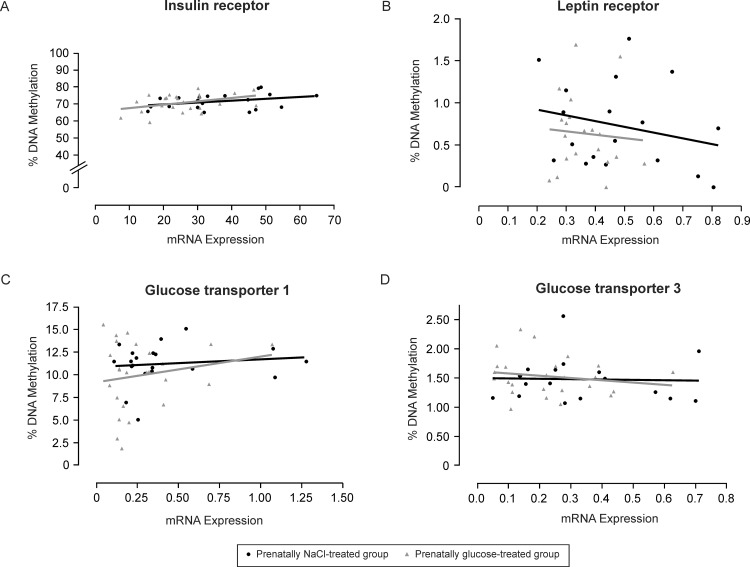
Fig 6. Correlation analyses.
Relations between total DNA methylation levels and corresponding mRNA expression of the insulin receptor (A), leptin receptor (B), glucose transporter 1 (C) and glucose transporter 3 (D) in the Nucleus infundibuli hypothalami (NI) in three-week-old chickens of prenatally NaCl-treated controls (black) as compared to the prenatally glucose-treated group (gray).

