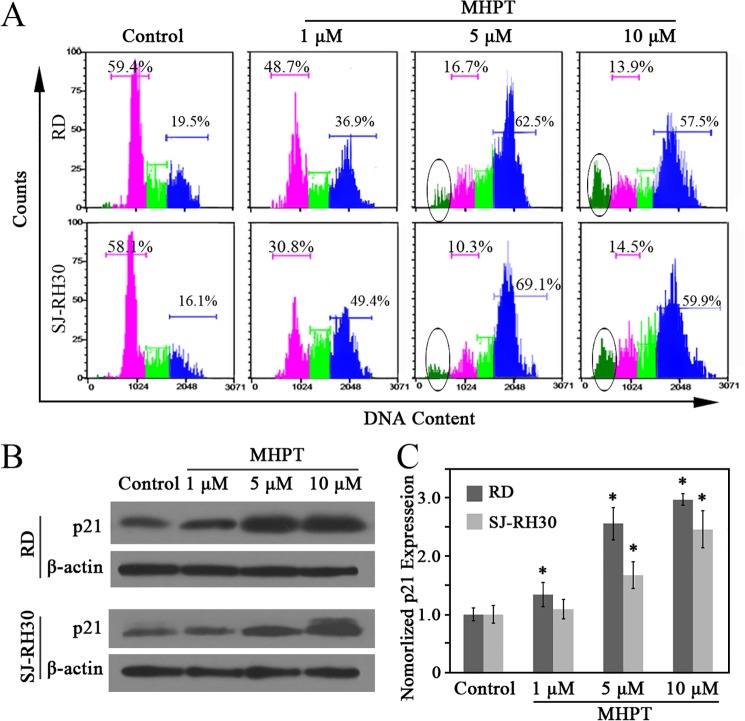
Fig 3. MHPT caused G2/M cell cycle arrest of RMS cells in a dose-dependent manner.
RMS cells were treated with DMSO (control) or MHPT at the indicated concentrations for 48 h. (A) RMS cells were stained and analyzed by a flow cytometry. The pink areas indicate arrest at the G1/G0 phase; the green areas indicate arrest at the S phase, the blue areas indicate arrest at the G2/M phase; and the circled areas indicate arrest at the sub-G1 phase. (B) Western blot analysis of p21 expression after MHPT treatment in RMS cells. (C) The ratio of p21 to β-actin was quantified by densitometric analysis using Image J software and normalized to the value of the control group. *, P < 0.05 versus control.

