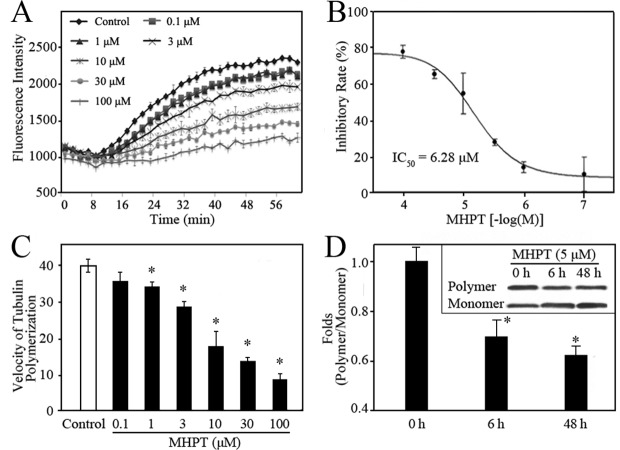
Fig 5. MHPT inhibited the polymerization of tubulin in a cell-free system (A-C) and in RD cells (D).
(A) The tubulin polymerization process was monitored by fluorescence in the presence of MHPT at the indicated concentration. Microtubule formation after the addition of DMSO (control) generated a polymerization curve representing three phases: nucleation (0-8 min), growth (10–40 min), and equilibrium (40–60 min). (B) MHPT inhibited tubulin polymerization in a dose-dependent manner. The inhibitory rate was calculated as the ratio of the fluorescence change obtained with MHPT treatment to the fluorescence change of the control. The IC50 was the concentration at which 50% inhibition was achieved. (C) The velocity of tubulin polymerization in the growth phase. The polymerization velocity was calculated based on the ratio of the fluorescence change to the reaction time. *, P < 0.05 versus control. (D) Polymeric and monomeric tubulin fractions were isolated as described in the Methods. Equal amounts of total protein in each sample were analyzed by Western blot. The ratio of polymeric to monomeric tubulin was quantified by densitometric analysis using Image J software after normalization to the value at the 0 h time point. *, P < 0.05 versus 0 time point.

