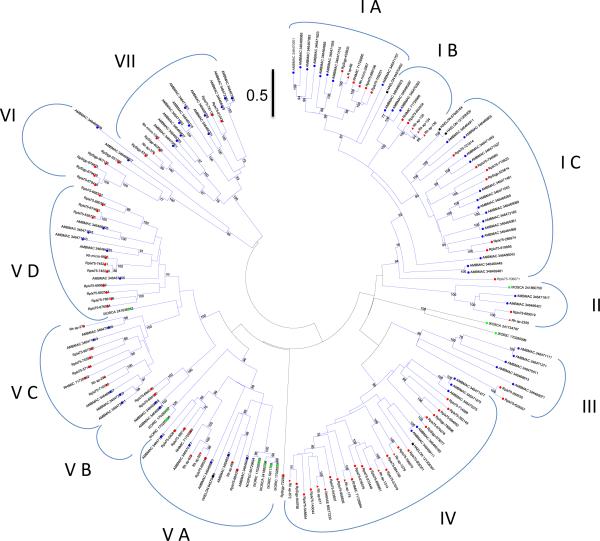
Figure 3. Phylogenetics of the salivary metalloproteases of ticks.
The evolutionary history was inferred using the Neighbor-Joining method [134]. The optimal tree with the sum of branch length = 75.51 is shown. The tree is drawn to scale, with branch lengths in the same units as those of the evolutionary distances used to infer the phylogenetic tree. The evolutionary distances were computed using the Poisson correction method [135] and are in the units of the number of amino acid substitutions per site. The rate variation among sites was modelled with a gamma distribution (shape parameter = 1). The analysis involved 170 amino acid sequences. All ambiguous positions were removed for each sequence pair. There were a total of 823 positions in the final dataset. Evolutionary analyses were conducted in MEGA5 [25]. The bar at the top indicates 50% amino acid divergence. Sequences from GenBank are recognized by having the first 3 letters of the genus name, followed by the first 3 letters of the species name, followed by their accession numbers. Rhipicephalus pulchellus sequences start with RP. Other sequences were derived from a tick sialomes review [2]. Markers of the same color are used for genus, and marker shape for species differentiation.

