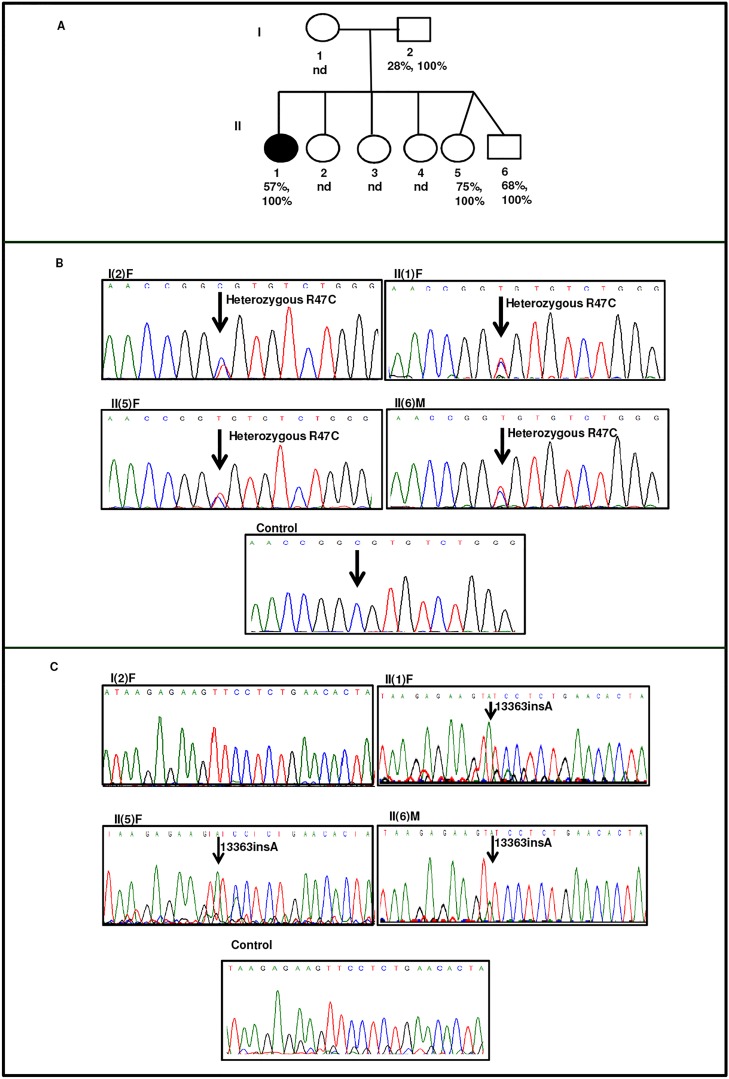
Fig 2. Identification of AT deficiency and mutation in family II.
A) Pedigree of family II. The proband, II(1)F are represented by dark oval. Anti-fXa activity and antigen levels are shown in the second and third row respectively. nd indicates not determined. B) Electropherograms indicating that proband, II(1)F and family members are heterozygous for 2603T>C R47C mutation. C) Electropherogram of the proband and family members are homozygous for insertion of A at position 13363. The electropherograms of family members is compared with that of the healthy control. The insertion of A causes a frameshift that changes the open reading frame.

