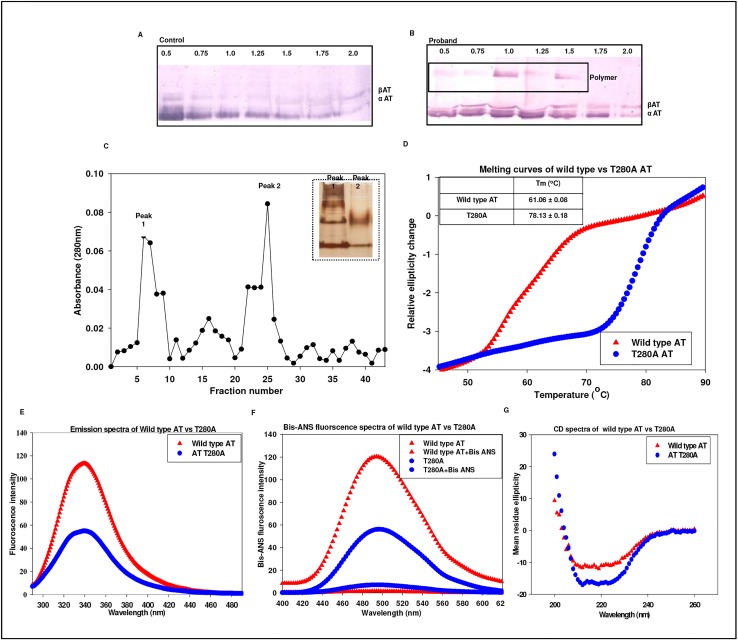
Fig 5. Biochemical characterization of T280A.
A) SDS-PAGE followed by immunoblotting in healthy control. B) SDS-PAGE followed by immunoblotting in proband, indicating presence of high molecular weight AT species in proband’s plasma. Pure AT at 2.0M NaCl concentration serves as an internal control as α and β isoforms of AT elutes at equimolar concentration. C) Elution profile of the polymerized and native species using gel filtration chromatography (G-100). Peak 1 and peak 2 are polymerized AT containing a low level of native AT. Shown in inset is NATIVE-PAGE indicating that T280A mutation causes spontaneous polymerization of AT in patient’s plasma. Lane 1: peak 1, lane 2: peak 2. D) Thermal stability of T280A and wild type AT. Mean ± S.D are reported for measurements done in duplicate. E) Fluorescence emission spectra of wild type compared with T280A AT. F) Wild type and T280A AT hydrophobicity studies by Bis-ANS fluorescence studies. G) Far UV-CD spectra of wild type and T280A AT showing changes in secondary structure. The results plotted are average of atleast three independent experiments.

