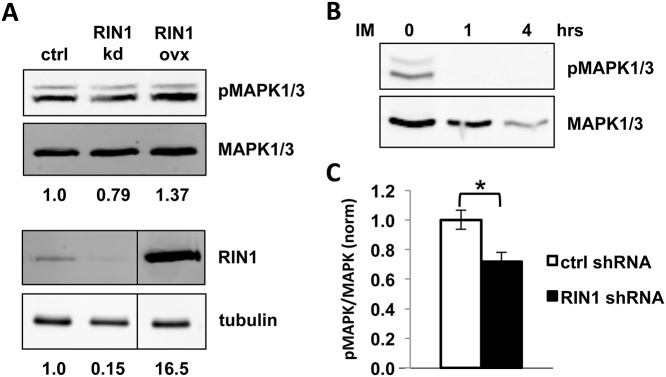
Fig 6. MAPK1/3 phosphorylation is RIN1 and BCR-ABL1-dependent in K562 cells.

(A) K562 cells expressing a control vector, RIN1 shRNA or RIN1 over-expression construct were analyzed by immunoblot with anti-pMAPK1/3 and anti-MAPK1/3 antibodies (top) and anti-RIN1 and anti-tubulin antibodies (bottom). Band intensity was quantified using LI-COR Odyssey software. Phospho-MAPK1/3 signal intensities were normalized to total MAPK1/3 and RIN1 normalized to tubulin. Changes in expression or phosphorylation were calculated as fold-change compared to control vector (normalized to 1) and presented below each blot. The immunoblot shown is representative of three independent experiments. (B) K562 cells were treated with 1 μM imatinib (IM) for 1 and 4 hours at 37°C, then analyzed by immunoblot as in A. (C) K562 cells expressing control or RIN1 shRNA were analyzed by immunoblot as in A. The ratio of pMAPK/MAPK signal intensity is graphed. Results were averaged over five independent experiments. *p-value = 1x10⁻⁴
