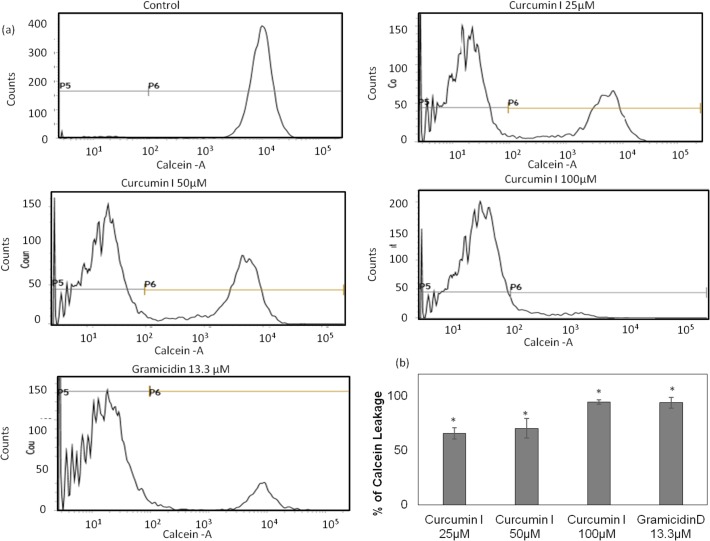
Fig 5. Membrane permeabilization of S. aureus by curcumin I using calcein-AM through flow cytometry.
Logarithmic S. aureus ATCC 29213 was labeled with calcein and analyzed for membrane permeabilization after incubation with different concentrations of curcumin I. A total of 10,000 cells were acquired for each flow cytometry analysis. (a) Histograms showing calcein leakage, on treatment with different concentration of curcumin I (0 μM (control), 25 μM, 50 μM & 100 μM), (b) percentage of calcein leakage from S. aureus cells on treatment with different concentration of curcumin I for 2h as quantified from different days of flow cytometry data. These data represents mean (±SD) of three independent experiments (*p ≤ 0.001).

