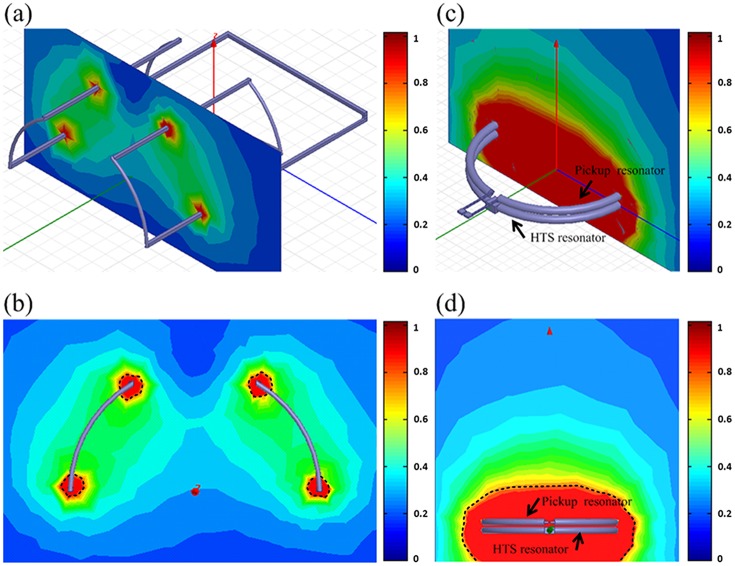
Fig 3. Ansoft HFSS simulated results of the QD surface resonator and the HTS surface resonators.
(a) The 3D view of the QD surface resonator at 300K. (b) The X-axis view of the QD surface resonator at 300K. (c) The 3D view of the HTS surface resonators at 77K. (d) The X-axis view of the HTS surface resonators at 77K.

