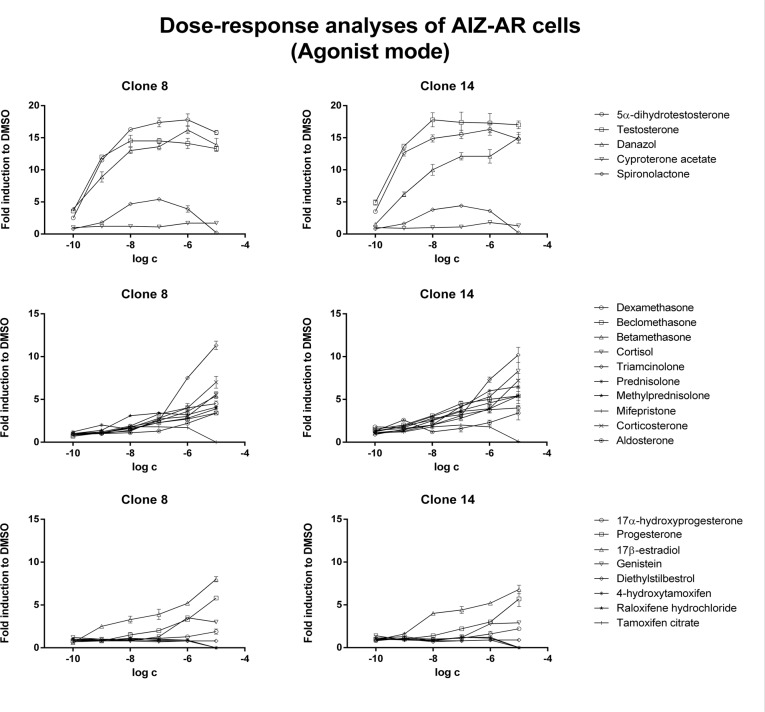
Fig 4. Dose-response analyses in AIZ-AR cells after treatment with steroid compounds—agonist mode.
Cells were treated for 24 h with various endogenous and synthetic steroids. Cells were lysed and luciferase activity was measured. Data are mean of triplicate measurements and are expressed as a fold induction over DMSO-treated cells. Similar data were obtained from three consecutive cell passages. Upper plots—androgens, middle plots—corticoids, lower plots—gestagens and estrogens.

