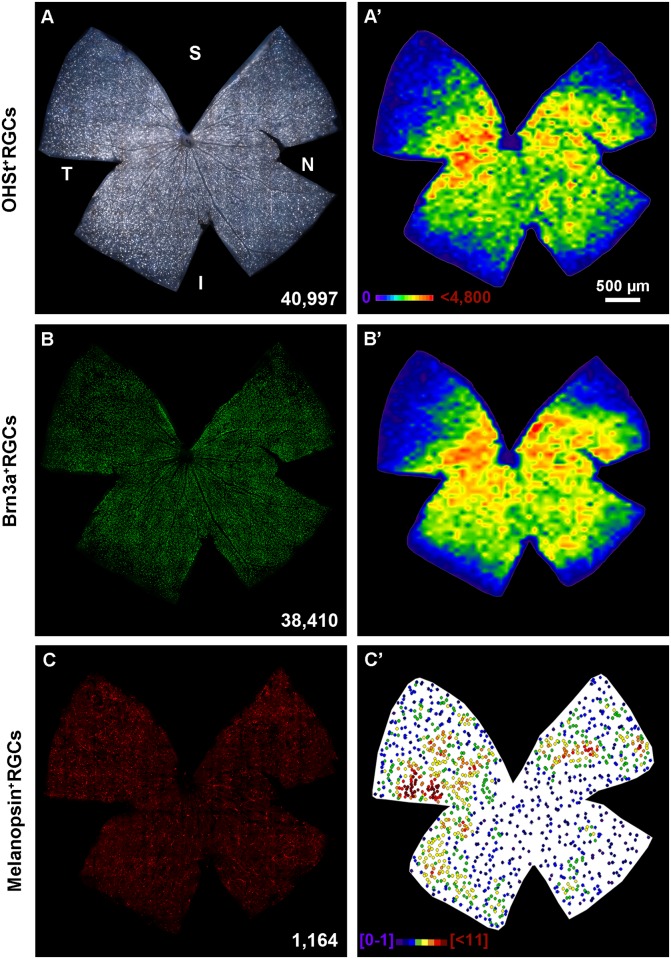
Fig 2. Distribution of traced-, Brn3a+ and melanopsin+ RGCs in control mice.
A-C Photomontages from the same left retina showing OHSt (A), Brn3a (B) and melanopsin (C) positive RGCs. Their distribution is shown in A'-C', respectively. A'-B': isodensity maps, C': neighbour map. Density or neighbour maps colour scales in A' and C'. At the bottom of each photomontage is shown its number of RGCs or m+RGCs. S: superior, V: ventral, N: nasal, T: temporal. Bar: 500 μm.

