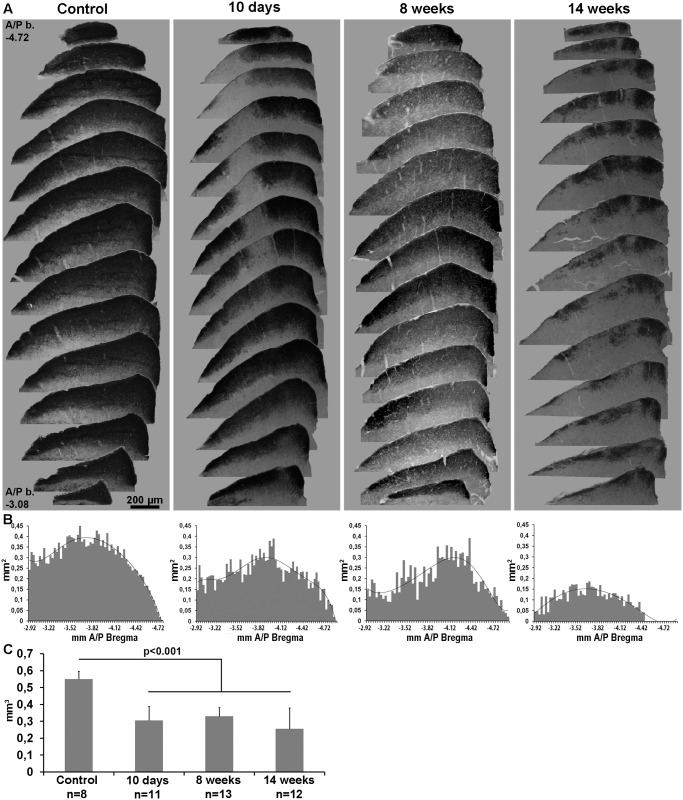
Fig 7. Deafferentation of the contralateral superior colliculus after OHT.
A: Serial coronal brain sections spanning the right (contralateral) superior colliculus (from anterior/posterior bregma coordinates: -3.08 to -4.72 mm) showing the retinal afferents labelled by anterograde tracing with CTB injected into the left eye. Left column: control SC. The remaining three columns show a representative example of a SC analyzed at 10 days, 8 weeks or 14 weeks after ocular hypertension (OHT). B: Plots of the area occupied by retinal afferents in the SC against the anterior-posterior distance (Bregma coordinates, in mm). These plots correspond to the SCs shown in A. C: Volume of the SC occupied by retinal afferents. n = number of SC analyzed. Compared to control SC, the volume of SC innervated by retinal axons decreases significantly after OHT (t-test p<0.001).

