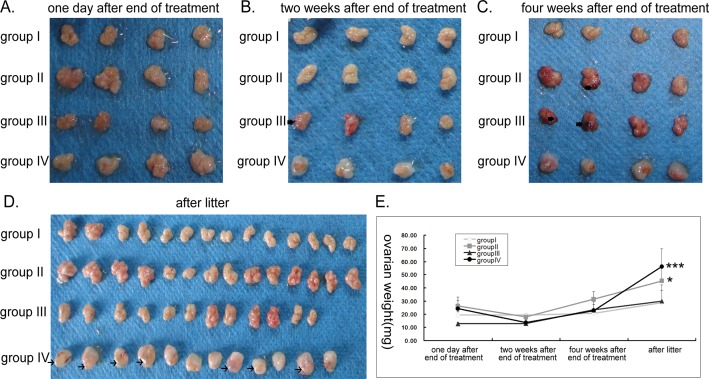
Fig 2. Ovarian morphology and weight at different time points following treatment cessation.
Ovarian morphology were compared between different groups at: (A) one day after end of treatment (2 rats), (B) two weeks after end of treatment (2 rats), the black thick arrow points to the black blot on the ovarian surface (C) four weeks after end of treatment (2 rats), the black thick arrow points to the black blot on the ovarian surface (D) after litter, the thin arrow points to the transparent follicles on the ovarian surface (7 rats in group I and group II, 6 rats in group III and group IV). (E) Ovarian weight at different time points. * p<0.05, *** p<0.001.

