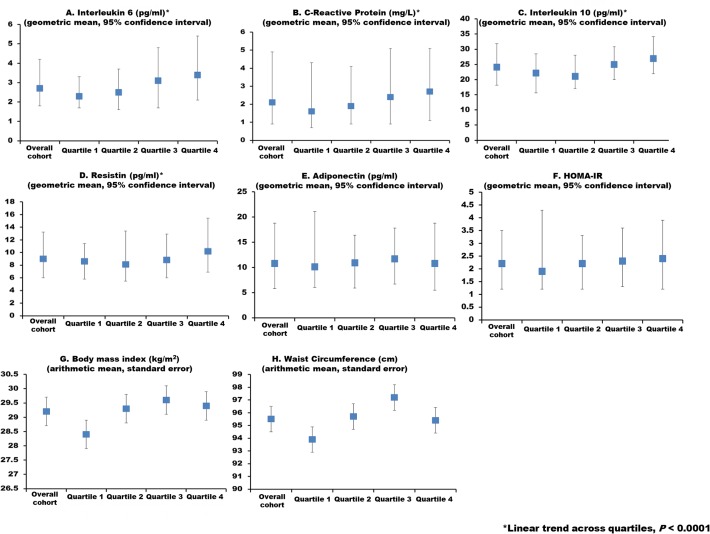
Fig 1. Markers of inflammation, insulin utilization and anthropometrics overall and by quartile of FGF23.
The first column represents the overall sample, and the subsequent columns represent FGF23 quartiles 1–4, respectively, in each panel. Values are presented as geometric means, 95% confidence intervals (interleukin-6, high sensitivity C-Reactive protein, interleukin-10, resistin, adiponectin, HOMA-IR)) or mean ± standard deviation (body mass index, waist circumference).

