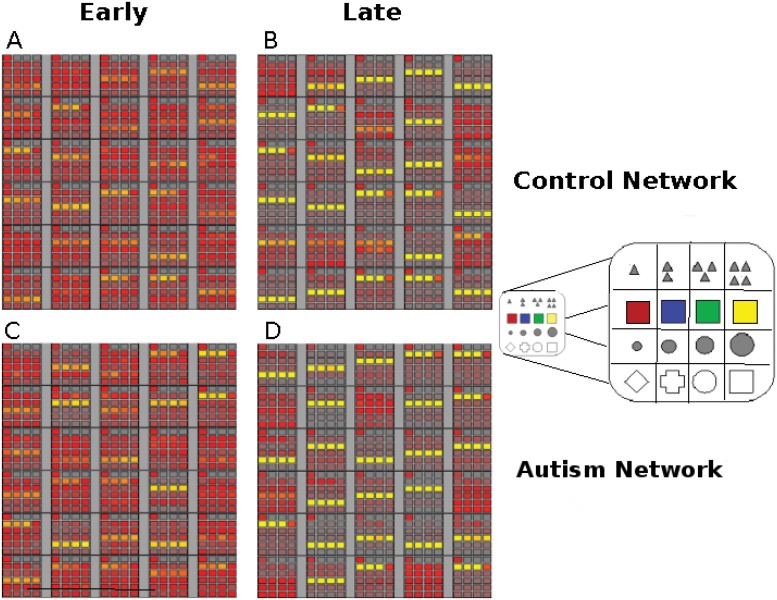
Fig 4. Comparing the development of PFC representations (synaptic strengths) between representative control (A, B) and autistic (C, D) networks.
Comparisons are made early in development (Epoch 5, left side) and late (100 epochs, right side). Each image shows the strength of the PFC connections to the response layer, with the strength represented by the brightness of the smaller box (lighter means stronger). Each row designates connections to response units representing features in the same stimulus dimension (as illustrated in E). Images A and B show strength of the PFC representations in early and late stages respectively, and images C and D show the same information for the network modeling autistic performance. Note the lack of strong dimensional representations for both experimental groups early in development (A and C) and the relatively strong dimensional representations late (B and D). Please see text for a more in depth explanation.

