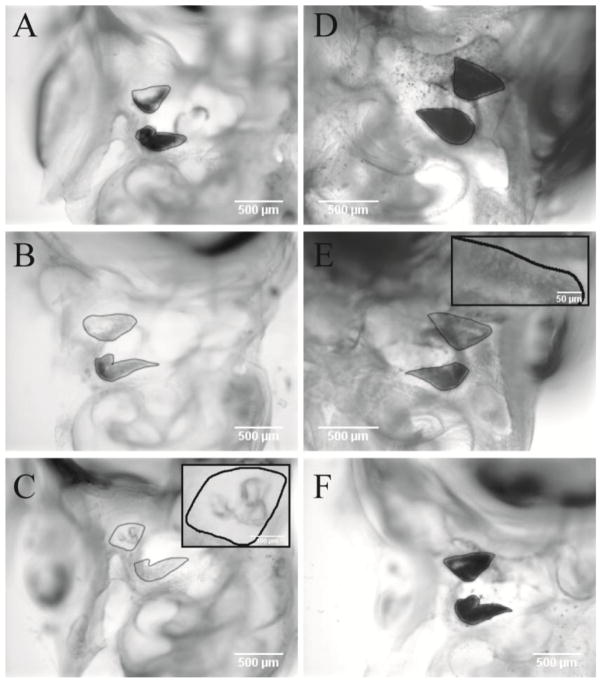
Figure 1.
Illustration of the method used for otoconia coverage scoring in the present paper. Shown are representative images of otoconial membranes (OM) overlaying the utricle and saccule in cleared temporal bones. Outer edges of OM have been outlined in black. A, B & C: AJ animals with varying grades of otoconial dysgenesis. A was given OM scores of 3 and 4 for the utricle and saccule respectively. B was scored as 2 for both the utricle and saccule. C represents an OM score of 1 for both utricle and saccule. C Inset: Utricular OM showing three giant crystals of otoconia. D & E: represent C17 animals. D had no coverage deficits for the utricle or saccule and was given an OM score of 4 for both macular organs. E had mild coverage deficits for both utricle and saccule (score 3). Inset shows coverage deficits and large abnormal otoconia in the lateral extra-striolar region of the utricle. F) C57 animal with normal utricle and saccule OMs with scores of 4. The resolution of pictures shown in this compressed collage is much less than that available during scoring of original micrographs.

