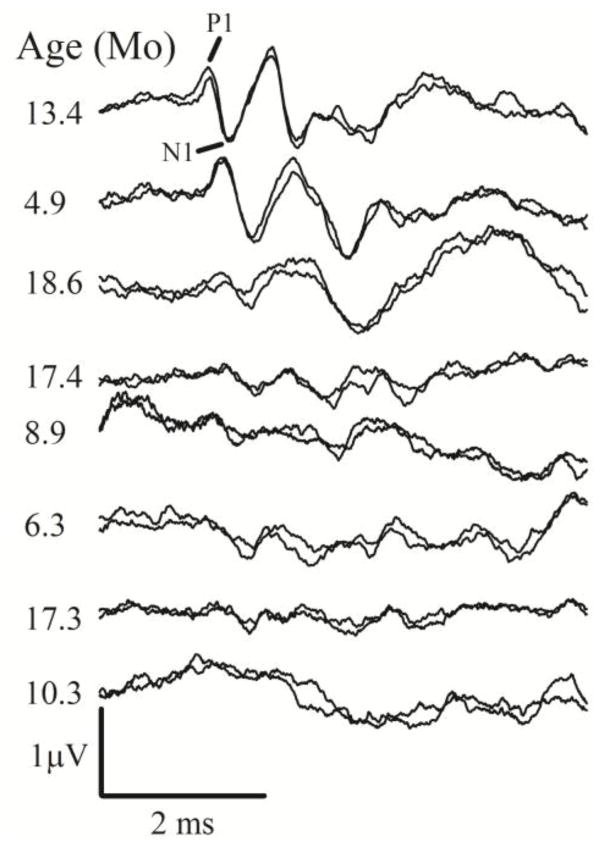
Figure 2.
VsEP waveforms from A/J mice. An assortment of VsEP response pairs illustrating representative examples of relatively normal (top), poor (middle) and absent responses (bottom). The range of responses shown represent normal to profound deficits in gravity receptor function ordered from top to bottom. Severity of the functional deficit was unrelated to age. Age of each animal is shown to the left of each response pair. Mo = months.

