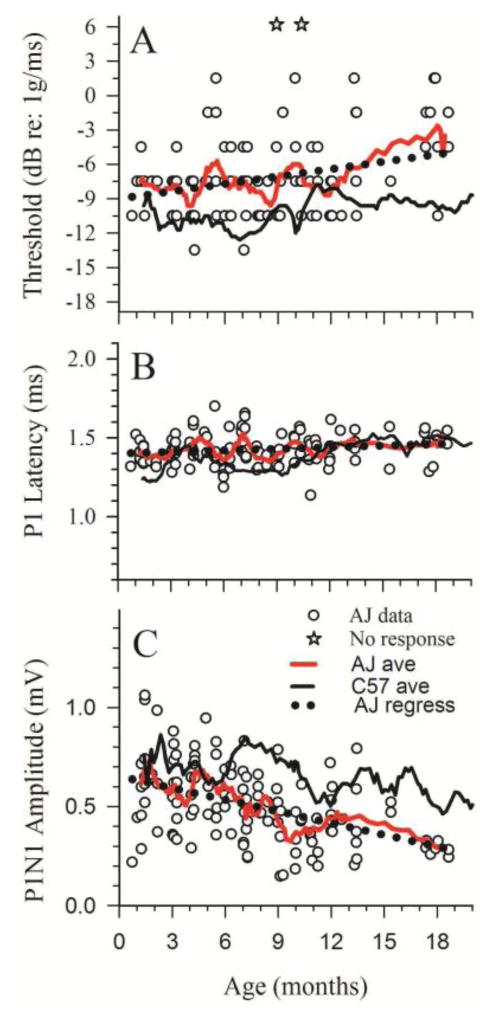
Figure 3.
A/J VsEP response metrics as a function of age. A/J VsEP thresholds (A), latencies (B) and amplitudes (C) are contrasted with response values for control C57 mice represented as a running average (black solid line [C57 ave]). Individual values for A/J mice are shown as open circles (AJ data). The running average for A/J findings are represented as a red solid line (AJ ave). Two A/J animals had no responses at the highest stimulus level (open stars in A). Regression lines for A/J data are shown as the dotted black line coursing with the A/J running averages.

