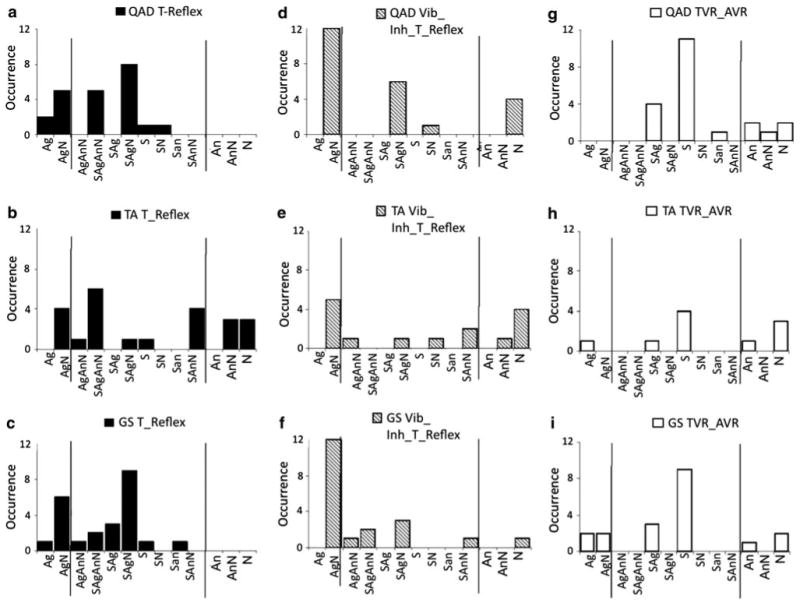
Fig. 5.

Response pattern occurrence for each stimulated muscle and stimulation type. Quadriceps (a, d and g), the tibialis anterior (b, e, h) and the gastrocnemius-soleus (c, f, i) for stimulation corresponding to T-reflex (left graphs), vibration-induced modulation of the T-reflex condition (middle graphs) and TVR/AVR (right graphs). The x axis is split in three parts that correspond to the patterns of responses elicited only in the stimulated muscle for a series of successive stimulations (i.e., Ag or AgN), responses elicited in both the antagonist muscle pair (middle) and responses evoked in the antagonist only (i.e., An, AnN). The y axis represents the number of pattern occurrence for a series of stimulations
