Fig. 6.
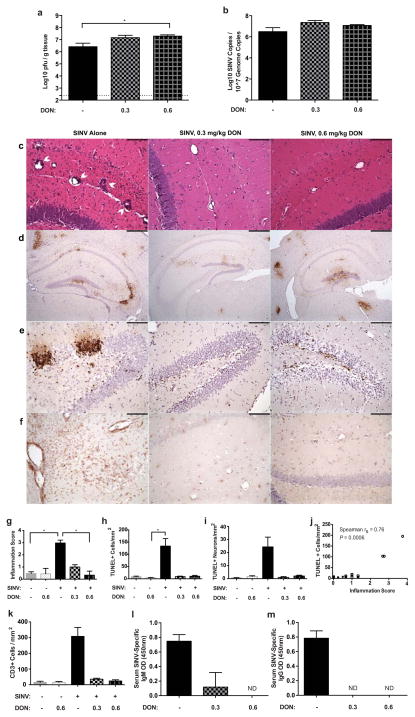
Effect of DON treatment on SINV, inflammation and cell death at 7 DPI. (a) Amounts of infectious SINV as determined by plaque formation were significantly higher in the brains of high dose (0.6 mg/kg) DON-treated mice than untreated mice (p ≤ 0.01 by Kruskal-Wallis test with *p ≤ 0.05 by Dunn’s multiple comparisons post test; N=4–6 mice per group; dotted line indicates the limit of detection). (b) SINV RNA levels in the brain as determined by qRT-PCR were not affected by DON treatment (N=3 mice per group). (c) Representative photomicrographs of hematoxylin & eosin-stained coronal brain sections demonstrating the effect of DON treatment on inflammatory cell infiltration into the hippocampus of SINV-infected mice (200X magnification; scale bar = 100μm). (d) Representative photomicrographs of immunohistochemical staining for SINV antigen in DON-treated or untreated, SINV-infected mice showing the comparable levels of SINV protein in the brain (SINV antigen = brown staining; 40X magnification; scale bar = 500μm). (e) Representative photomicrographs TUNEL staining of the dentate gyrus in the hippocampus of SINV-infected mice showing higher numbers of apoptotic/necrotic cells in untreated mice compared to DON-treated mice (DNA fragmentation = brown nuclear staining; 200X magnification; scale bar = 100μm). (f) Representative photomicrographs CD3 staining of the hippocampus of SINV-infected mice showing higher numbers of CD3+ cells in untreated mice compared to DON-treated mice (CD3+ cells = brown staining; 200X magnification; scale bar = 100μm). (g) Quantification of inflammation showed greater levels in the brains of untreated, SINV-infected mice compared to mock-infected control mice and high dose (0.6 mg/kg) DON-treated, SINV-infected mice (p ≤ 0.01 by Kruskal-Wallis test with * p ≤ 0.05 by Dunn’s multiple comparisons post test; N=3–6 mice per group). (h) Quantification of apoptotic/necrotic cells showing greater numbers in the hippocampus of untreated SINV-infected mice than mock-infected or DON-treated mice (p ≤ 0.05 by Kruskal-Wallis test with * p ≤ 0.05 by Dunn’s multiple comparisons post test; N=3 mice per group). (i) Quantification of apoptotic/necrotic neuronal cell bodies in the granule layer of the dentate gyrus and pyramidal layer of the CA regions, showing greater numbers in untreated SINV-infected mice than mock-infected or DON-treated mice (p ≤ 0.05 by Kruskal-Wallis test; N=3 mice per group). (j) Inflammation score and number of TUNEL+ cells are positively correlated (open symbols = SINV infection, closed symbols = PBS mock infection, circles = no treatment, squares = DON treatment; N=17 mice). (k) Quantification of CD3+ cells showing greater numbers in the hippocampus of untreated SINV-infected mice than mock-infected or DON-treated mice (p ≤ 0.05 by Kruskal-Wallis test; for all bar graphs, N=3 mice per group per time point). OD measurements at 450nm for SINV-specific IgM (l) and IgG (m) in serum show decreased to undetectable levels in DON-treated mice (p ≤ 0.05 by Kruskal-Wallis test; N=2–4 mice per group; for all bar graphs, data presented as mean ± SEM)

