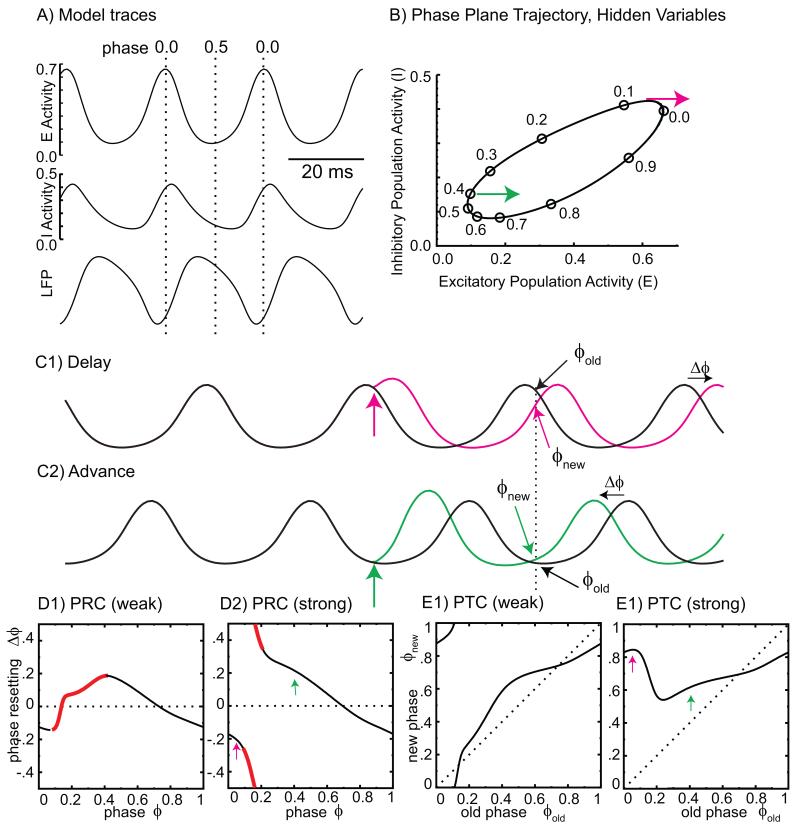
Figure 1. Phase-resetting explained using the Wilson-Cowan model.
A. Excitatory (E) and inhibitory (I) activity and the simulated local field potential (LFP). Phase 0 is the peak of the E activity. B. Phase is marked on the cycle in the plane of the firing rates of the two populations. Magenta and green arrows indicate the direction of an external excitation (applied to the excitatory population). C. An external perturbation (vertical colored arrows) phase shifts the perturbed (colored) traces for the excitatory poplation compared to unperturbed (black) traces by the amount shown by horizontal arrows. (C1) An input at phase 0.05 causes a delay. (C2). An input at phase 0.4 causes an advance. The old phase just prior to the stimulus is repeated on the unperturbed (black) waveform at multiples of the cycle period (vertical dashed line) after the input, but the new phase on the colored traces at that point differs from the old phase by the phase shift. D. The PRC plots the phase shift as a function of the phase of the input perturbation. Slopes outside the stabilizing range (−2 to 0) are indicated in red. (D1) Weak input. (D2) Strong input. The arrows correspond to the perturbations in B and C. E. The phase transition curve plots the new phase (modulo one) versus the old phase. E1. For a weak input, the range of new phases is equal to that of old phases. E2. For a strong input, the range of new phases can be much smaller than the range of old phases.

