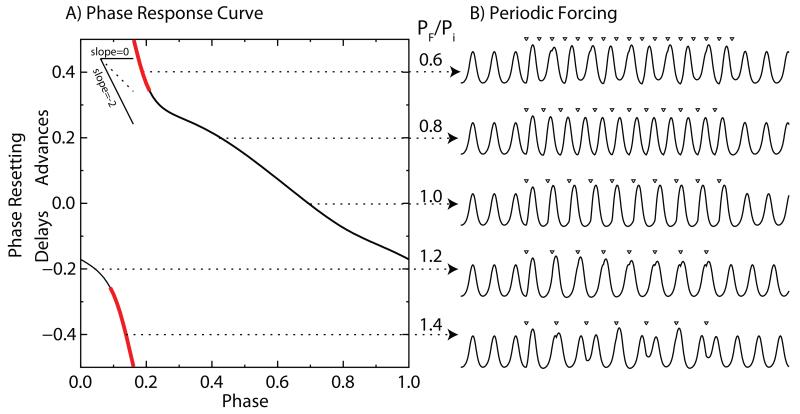
Figure 2. Phase-locking explained using the Wilson-Cowan model.
A. Phase response curve for strong input as in Figure 1D2. B. Forcing with a periodic train of stimuli (open triangles) at different PF/Pi ratios produces phase-locking only in the middle three traces, in which the corresponding point on the PRC exists and a slope within the stable range (see inset). Red indicates an unstable slope. Note that the position of the triangles within the forced cycle shifts as the forcing frequency changes.

