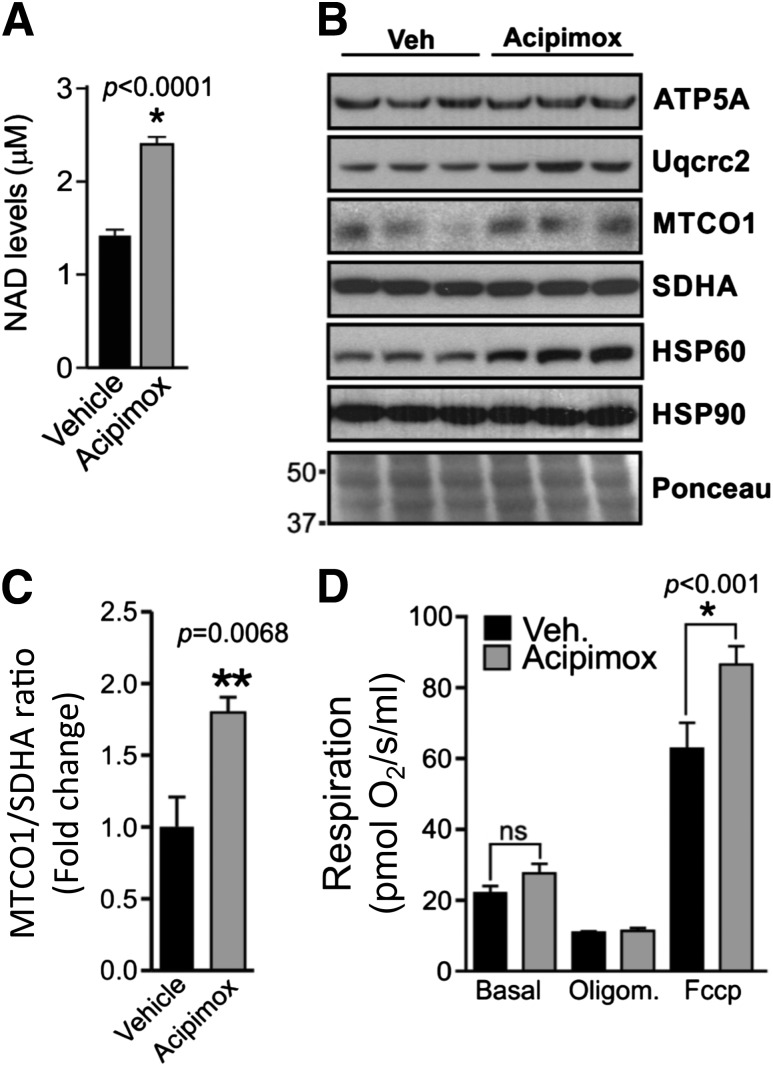
Figure 5.
Effect of acipimox on mitochondrial function in C2C12 cells. A: NAD+ levels after 3 h of acipimox 10 mmol/L incubation in myotubes (n = 6). B: Evaluation of ATP5A, Uqcrc2, MTCO1, SDHA, and HSP60 protein levels in C2C12 cells 24 h after acipimox 10 mmol/L incubation. HSP90 and Ponceau staining served as a loading control. C: MTCO1/SDHA ratio after acipimox 10 mmol/L incubation. D: Evaluation of mitochondrial respiration at the basal condition or after oligomycin and FCCP administration in C2C12 cells 24 h after acipimox 10 mmol/L incubation (n = 6). *P < 0.05, **P < 0.01. Oligom, oligomycin; Veh, vehicle.

