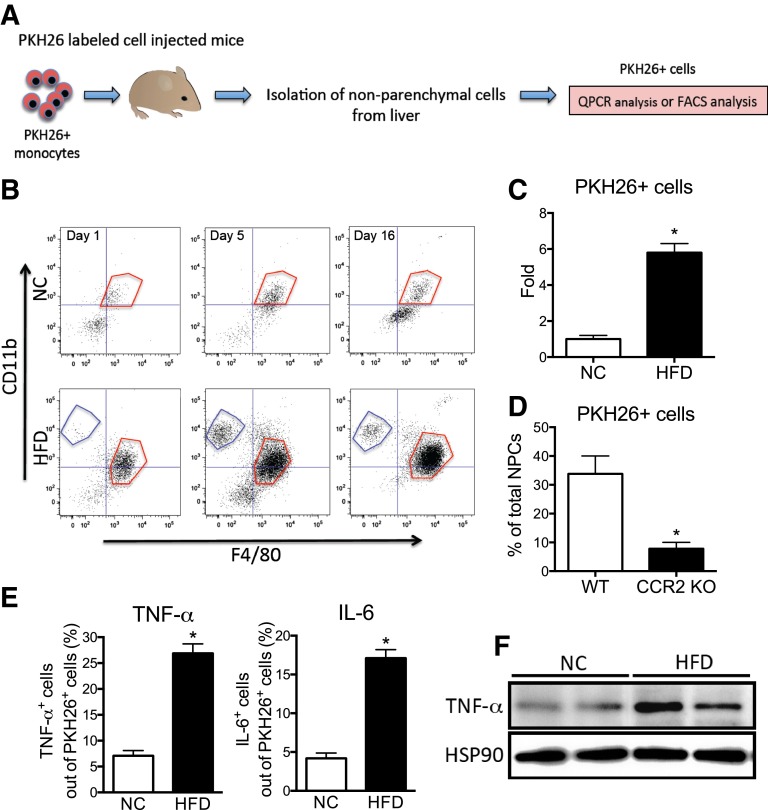
Figure 2.
RHM isolation with PKH26 fluorescent labeling. A: Schematic diagram of RHM isolation and characterization with PKH26+ fluorescent-labeled monocytes. B: FACS analyses of PKH26+ cells isolated from lean or obese mouse livers 1, 5, or 16 days after injection with PKH26+-labeled monocytes. Cells were first gated out of total NPCs for PKH26 and then plotted for F4/80+ and CD11b+ fluorescence. F4/80low/CD11b+ (blue-gated) and F4/80high/CD11b+ (red-gated) fraction, similar to the R3 and R2 cells observed in Fig. 1B. The scattergram is representative of four to five independent mice from each group. C: Average number of PKH26+ cells from lean and obese mouse liver was analyzed by FACS and then plotted as fold induction ± SEM from three independent experiments (n = 4 in each group). *P < 0.05 compared with NC vs. HFD. D: FACS analysis of the average number of PKH26+ cells isolated from HFD-fed recipient mice after injection PKH26+-labeled monocytes from WT or CCR2 KO donor mice. Mean ± SEM from three independent experiments (n = 5 in each group). *P < 0.05 compared with WT vs. CCR2 KO. E: TNF-α+ (left) and interleukin-6+ (right) cells were gated out of PKH26+ cells from NPCs of lean and obese mouse liver by FACS and then plotted as the mean ± SEM from three independent experiments (n = 5 in each group). *P < 0.05 compared with NC vs. HFD. F: Western blot analysis of TNF-α protein expression in PKH26+ cells from lean and obese mouse NPCs. PKH26+ cells from lean and obese mouse NPCs were sorted by FACS and then cultured overnight before protein isolation. HSP90 was used as the loading control. The image is representative from three independent Western blots (n = 2 for each group per Western blot).

