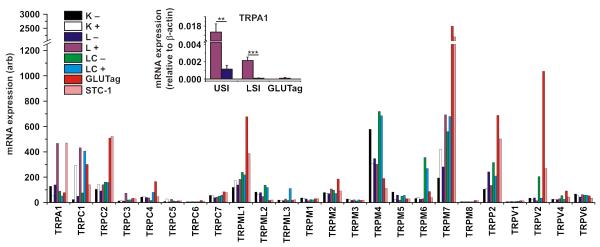
Figure 1. Expression profiles of TRP channel mRNAs within discrete enteroendocrine cell populations.
Main figure shows microarray analysis for the TRP superfamily. Expression of each TRP mRNA was assessed by RMA analysis from murine small intestinal K (K+) and L (L+) cells, colonic L-cells (LC+), as well as GLUTag and STC-1 cell lines. Each primary enteroendocrine cell population was compared to their respective negative population (K−, L− and LC−). Inset shows real-time quantitative PCR analysis of trpa1 mRNA in the upper small intestine (USI) and lower small intestine (LSI) within murine L+ and L− cell populations, as well as GLUTag cells. Values are normalised to the expression of β-actin from the same cell populations (n≥3, **p<0.01, ***p<0.001, two-way unpaired Student’s t-test).

