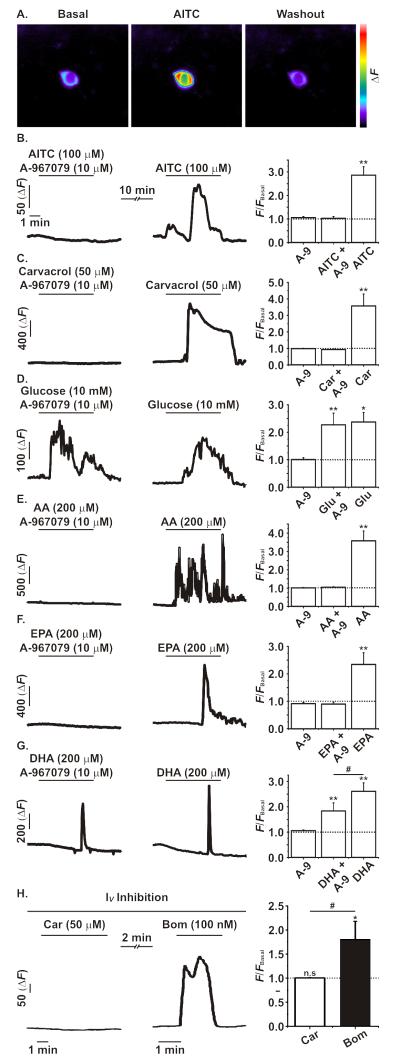
Figure 2. Ca2+ imaging analysis of TRPA1 in primary small intestinal L-cells using GLU-Cre/ROSA26-GCaMP3 mice.
A. Representative images showing the change in GCaMP3 fluorescence before, during and after the application of AITC (100 μM) to a primary duodenal L-cell cultured from GLU-Cre/ROSA26-GCaMPe mice. B and C. The application of AITC (100 μM) or carvacrol (Car, 50 μM) caused a robust and significant increase in intracellular Ca2+ as measured by GCaMP3 fluorescence; an effect that was inhibited by the co-application of the TRPA1 inihibitor A-967079 (A-9, 10 μM). D. Glucose (10 mM) application significantly increased intracellular Ca2+ levels independent of TRPA1 inhibition. E-G. The addition of polyunsaturated acids AA, EPA and DHA (all at 200 μM) significantly increased intracellular Ca2+ levels. The co-application of A-967079 fully inhibited the effects of AA and EPA, but only partially inhibited the effect of DHA on intracellular Ca2+ levels. H. Carvacrol (Car; 50 μM) caused no change in intracellular Ca2+ levels during a complete voltage-gated ion channel block (see methods). In contrast, the subsequent application of the Gq activator bombesin (Bom; 100 nM) did cause a significant increase in intracellular Ca2+ levels. All experiments were n≥5, */#p<0.05, **p<0.01, repeated measures ANOVA with Bonferroni post-hoc test; * indicates significance level from baseline and # indicates significance level between groups. The dotted line on each graph represents the respective baseline value.

