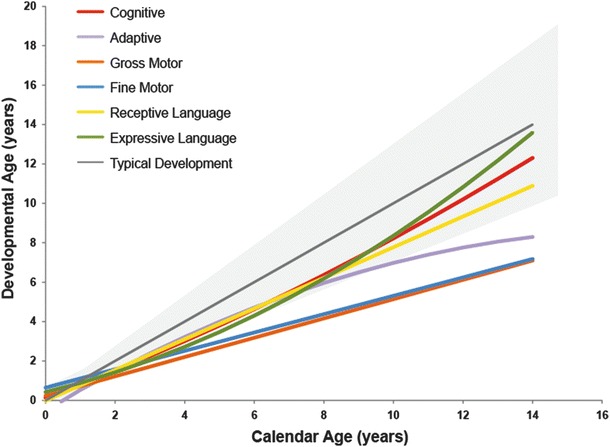
Fig. 1.

Neurodevelopmental function of children with Hurler syndrome after umbilical cord blood transplantation compared to that of unaffected children. Age-equivalent scores were used to compare and monitor developmental progress. The colored lines depict the mean developmental curves (i.e., cognitive, adaptive, gross motor, fine motor, receptive language, and expressive language) of the surviving patients. These lines were plotted against the mean typical cognitive growth curve (gray continuous line) and approximate variability (95%; gray area) observed in typically developing children
