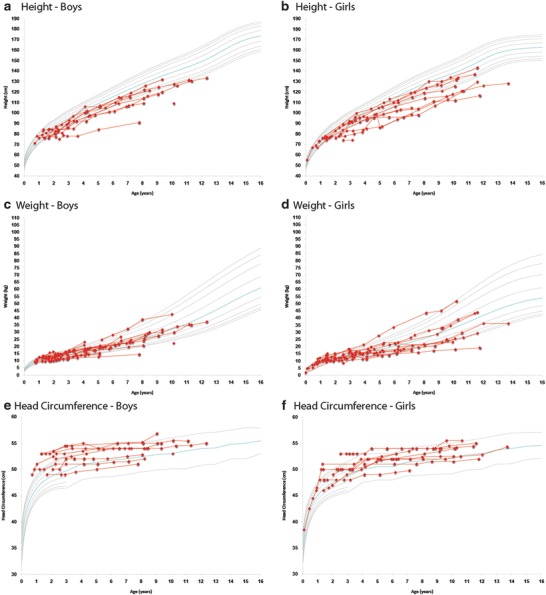
Fig. 2.

Longitudinal height, weight, and head circumference in boys and girls from umbilical cord blood transplantation until last follow-up visit. The gray curves represent standard growth curves (3rd, 5th, 10th, 25th, 50th, 75th, 90th, 95th, and 97th percentiles) for (a, b) height, (c, d) weight, and (e, f) head circumference. The red lines represent individual patients
