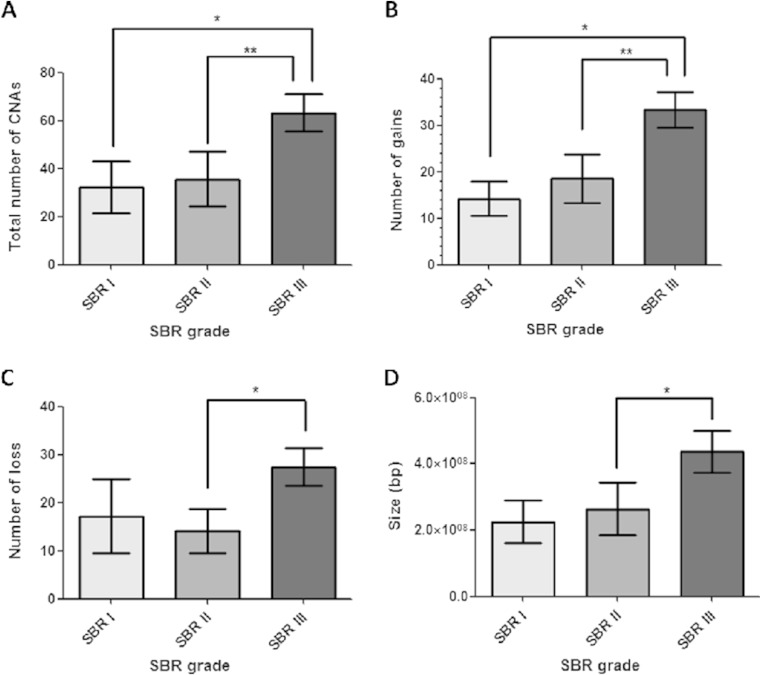
Fig. 2.
Statistical analysis comparing the DNA copy number aberration (CNA) events between different breast carcinoma groups according to histologic grades. Asterisks indicate statistical significance. a Bar graph of the total number of CNAs showing significant differences between tumor grades I and II compared to grade III. b Bar graph of the number of gain events showing significant differences between tumor grades I and II compared to grade III. c Bar graph of the number of loss events showing significant differences between tumor grades II compared to grade III. d Bar graph of the genomic alteration sizes of breast tumors showing significant differences between grade II tumors compared to grade III

