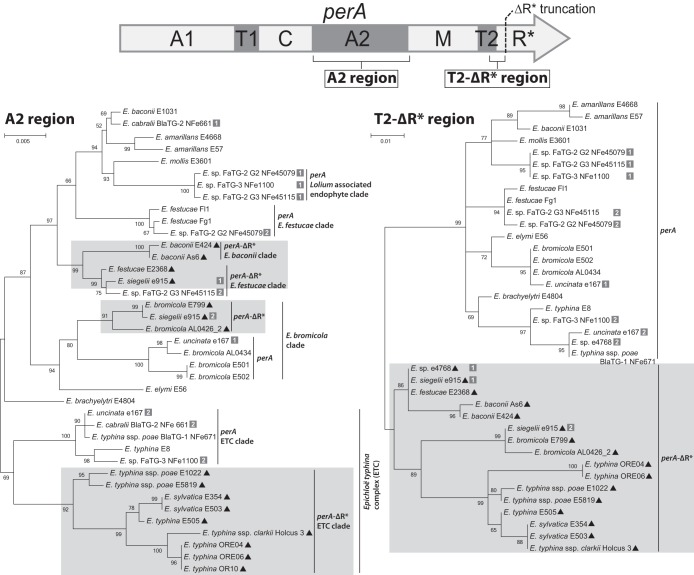
FIG 6.
Phylogenetic tree of perA A2-domain DNA sequence. Shown are unrooted maximum likelihood phylogenetic trees generated from all available perA and perA-ΔR* A2-domain and perA-ΔR* sequences spanning from the middle of the T2 domain to the perA-ΔR* truncation location (T2-ΔR*), ending immediately prior to where homology between the perA and perA-ΔR* sequences stops. The regions used to generate each phylogenetic tree are shown relative to a perA gene map at the top of the figure, with PerA domain abbreviations detailed in the legend to Fig. 2. Black triangles next to isolate numbers identify the perA-ΔR* alleles. Numbers next to entries from hybrid species indicate which allele is represented.

