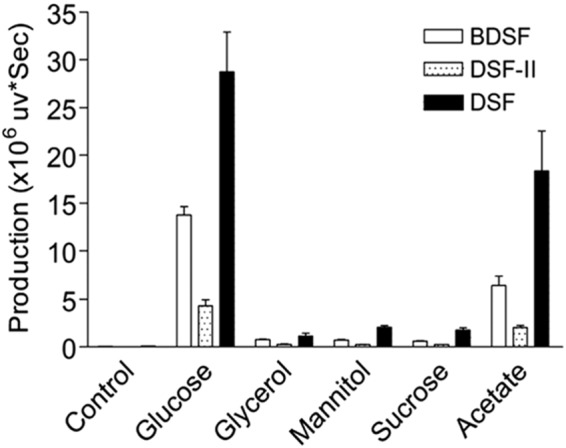
FIG 6.

Analysis of the DSF family signal production by the ΔrpfC strain with addition of 15 mM concentrations of different carbon sources. The data shown are the means of the results of three repeats, and error bars indicate standard deviations. The relative amounts of signal molecules were calculated on the basis of their peak areas.
