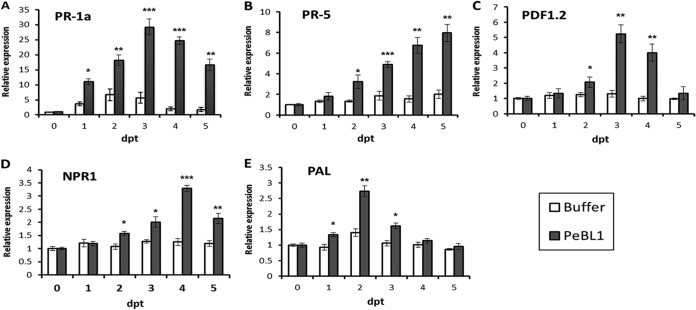
FIG 7.
Expression levels of N. benthamiana defense-related genes relative to the control. N. benthamiana leaves were infiltrated with 10 μM PeBL1 or buffer. At the indicated times, a small fragment was taken from the upper leaves, and the amounts of mRNAs of five defense-related genes were measured by RT-qPCR. Shown are the relative expression levels of the PR-1a (A), PR-5 (B), PDF1.2 (C), NPR1 (D), and PAL (E) genes. The samples were normalized against EF-1α. The expression levels are represented as the fold change in relation to the untreated control. The results are mean values from three independent experiments ± SD. The statistical analyses were performed using Student's t test. The asterisks indicate significant differences between the PeBL1-treated samples and buffer-infiltrated controls at the same point (*, P < 0.05; **, P < 0.01; ***, P < 0.001).

