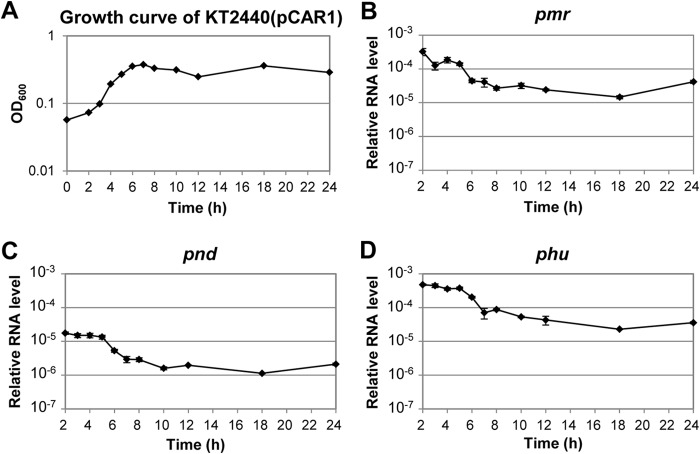
FIG 2.
Transcriptional profiles of the pCAR1 genes encoding NAPs. (A) Growth curve of KT2440(pCAR1). (B to D) The mRNA levels of pmr (B), pnd (C), and phu (D) were measured by qRT-PCR along the growth curve. The data were normalized using the average of the 16S rRNA data as the internal standard. Means and standard deviations (error bars) of triplicate data are shown.

