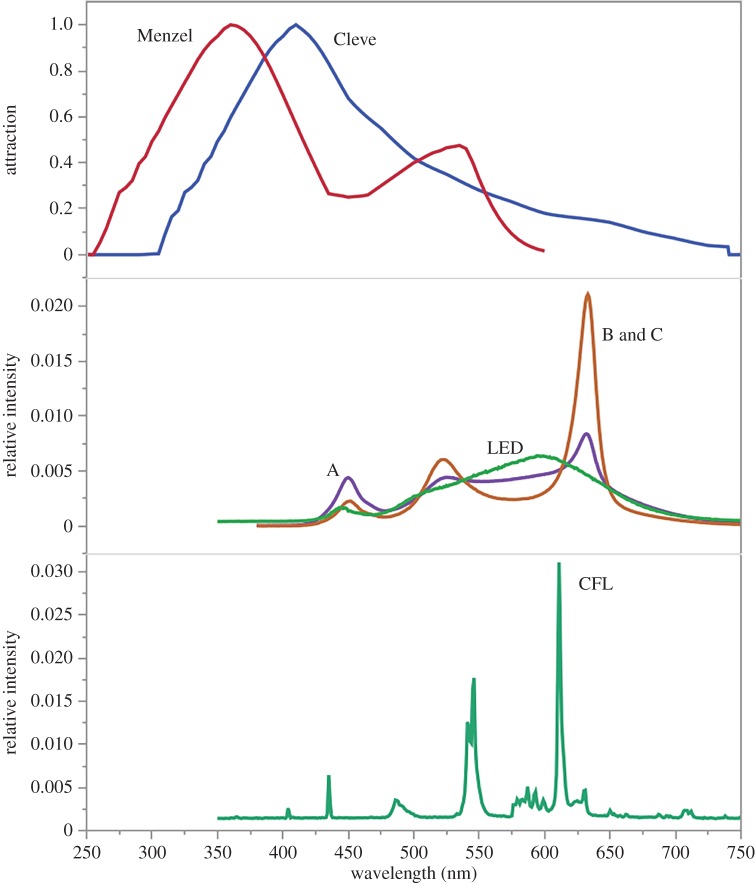
Figure 3.
Insect attraction and lamp output curves by wavelength. Top: response curves for moths (Cleve) [40] and honeybees (Menzel) [31]. Middle: output from 3500 K custom LED (A), 2700 K custom LEDs (B,C, with differences so minor they are not visible at this scale) and commercial 2700 K LEDs (LED; representing two lamps with minor differences). Bottom: output from commercial 2700 K compact fluorescent lamp (CFL; representing two lamps with minor differences). (Online version in colour.)

