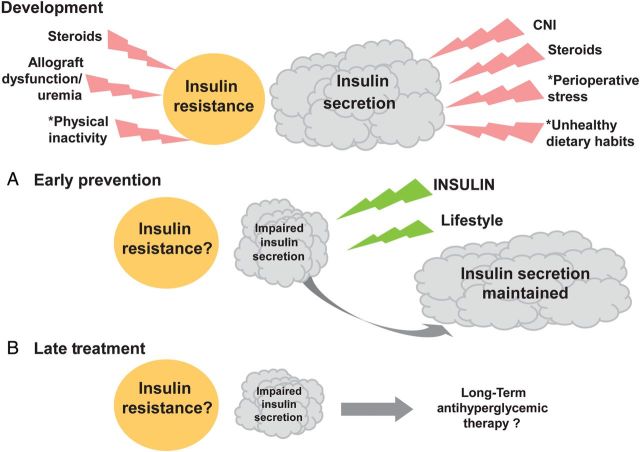
FIGURE 2:
General mechanisms of NODAT development, (A) early postoperative prevention and (B) late postoperative treatment. Beta cell mass inside the pancreas leading to insulin secretion is depicted by the clouds. The idea that beta cells can become stressed is symbolized by the warning flashes. Insulin resistance is depicted by the circle, and contributors to insulin resistance are also symbolized by flashes. When describing early post-transplant status (upper part of the figure = development), the figure explicitly contains only general mechanistic details, but no patient-specific risk factors of NODAT development, such as age, obesity, family history, ethnic background and viral infection, which may further influence insulin secretion and insulin resistance in a patient-specific manner. Asterisk denotes that these factors are listed in the text as contributors to hyperglycaemia (a, b and c). (A) Early basal insulin and lifestyle intervention (diet and exercise) act against evening hyperglycaemia and are helping beta cells to overcome the burden imposed after renal transplantation, as symbolized by green flashes. Insulin secretion may consequently increase. (B) Long-term anti-hyperglycaemic treatment may become necessary in stable KTRs if NODAT prevention has not been established or has failed. Note that the circle symbolizing insulin resistance is neither augmented nor diminished after renal transplantation, because the progression of insulin resistance is currently still a matter of debate. However, as indicated in the text, convincing evidence indicates that insulin resistance may even increase.

